
DAI supplier management portal reporting platform
A scalable approach to local content compliance
- Platform
- Web app
- Industry
- Local content compliance reporting
Overview
DAI is a global development company that partners with governments, corporations, and philanthropies to address critical social and economic challenges. Since 1970, it has worked in over 150 countries to promote governance, create inclusive markets, and ensure stability. Its Sustainable Business Group (SBG) supports clients in aligning commercial and social impact goals through supply chain localization and targeted social investment. SBG’s key product, the Supplier Management Portal (SMP), enables buyers to source local suppliers and strengthen their social license to operate.
We were brought in to redesign the legacy local content reporting features, used to track how much labor, goods, and services are sourced locally, and integrate them directly into the SMP for a more cohesive experience. Our goal was to create a more intuitive, transparent, and scalable reporting tool that enables companies to meet regulatory requirements and build stronger relationships with host governments and communities.
The platform also includes a local supplier sourcing feature, which will be covered in a separate case study.
My role
I joined the project post-discovery and quickly ramped up by thoroughly reviewing the research materials. I collaborated with another designer, working closely with two product managers and a team of twelve developers to design and deliver key features.
Outcome
98%
New client onboarding is supported by report builder
Structured data collection at the source
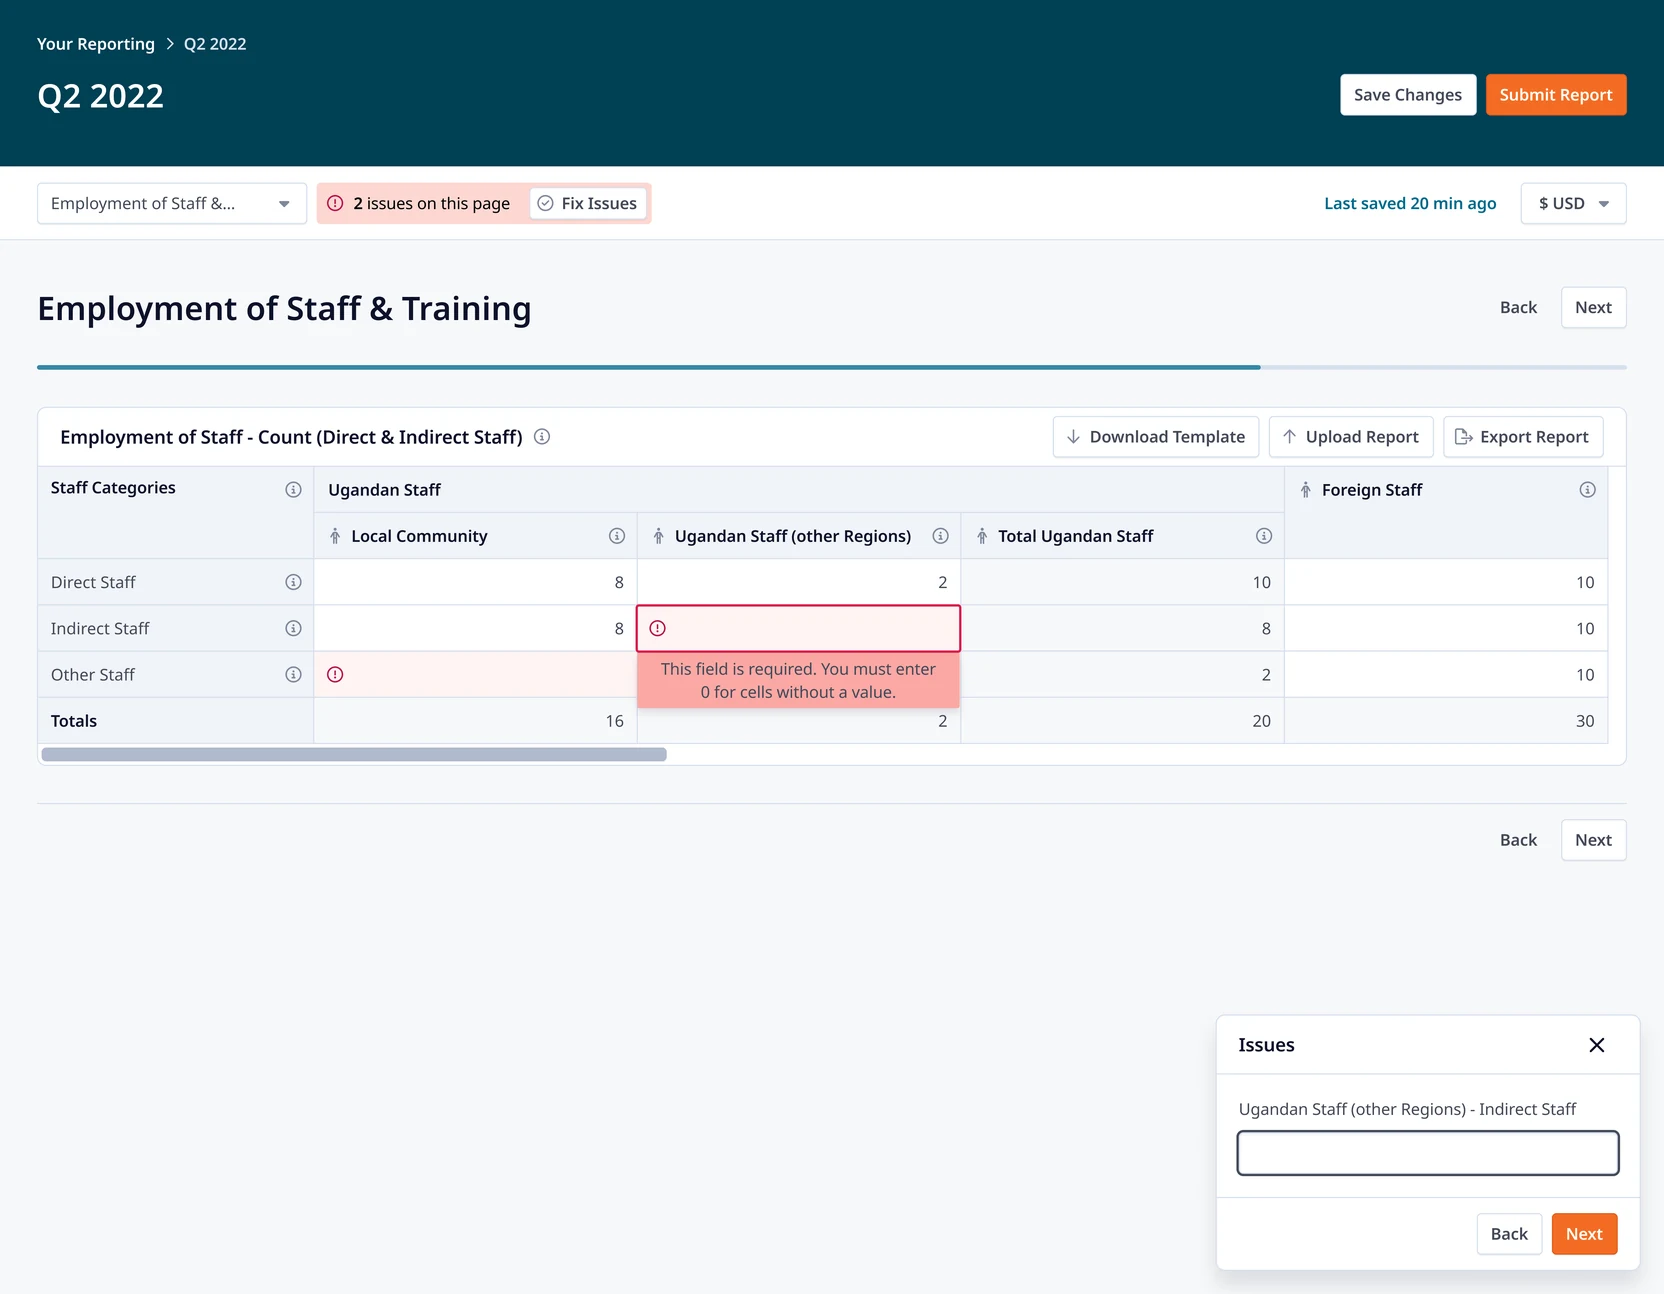
Previously, local content data was scattered across countless Excel sheets, with aggregation and analysis handled manually: a time-consuming and error-prone process.
We introduced a centralized reporting workflow that starts with structured supplier input. For users with limited connectivity, suppliers can also download a template, fill it out in Excel, and re-upload it to the platform. Built-in data validation ensures submissions are complete and accurate, eliminating the need for manual cleanup and laying the foundation for reliable, scalable reporting.
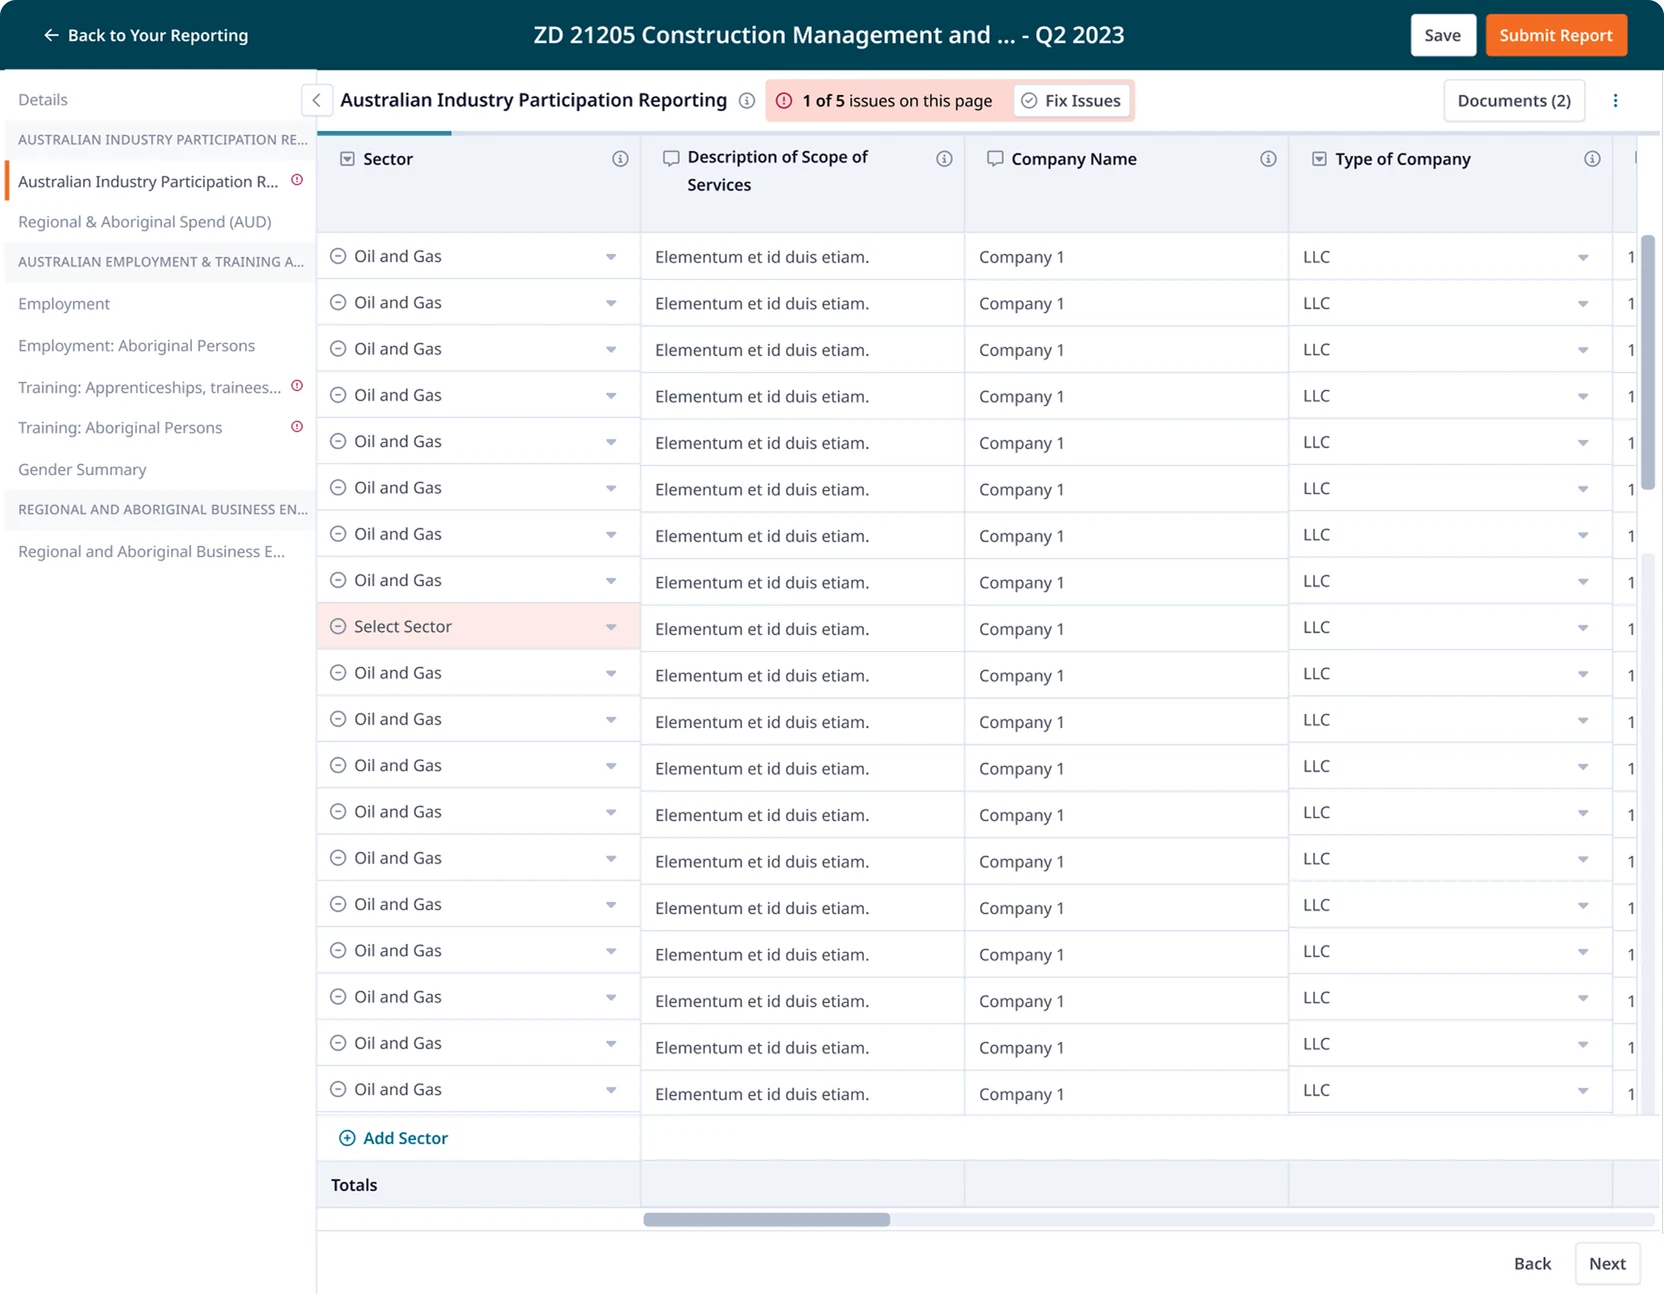
After conducting usability testing, we discovered that the existing layout, displaying multiple tables on a single page, worked fine for short or fixed-length tables. However, for dynamic tables where users can add an unlimited number of rows (such as the procurement table), this structure quickly became impractical. Some users needed to scroll through hundreds or even thousands of entries just to reach the next table, leading to poor navigation and reduced efficiency.
To address this, we restructured the reporting experience to display one table per page. The used-to-be “page” now represents a logical section or group of related tables, accessible via a left navigation bar. This allows users to switch between tables effortlessly without excessive scrolling. We also made the left nav collapsible and optimized the top navigation bar into a compact form to maximize available screen space for the data table itself, improving overall readability and focus.
Simplifying local content data aggregation across the supply chain
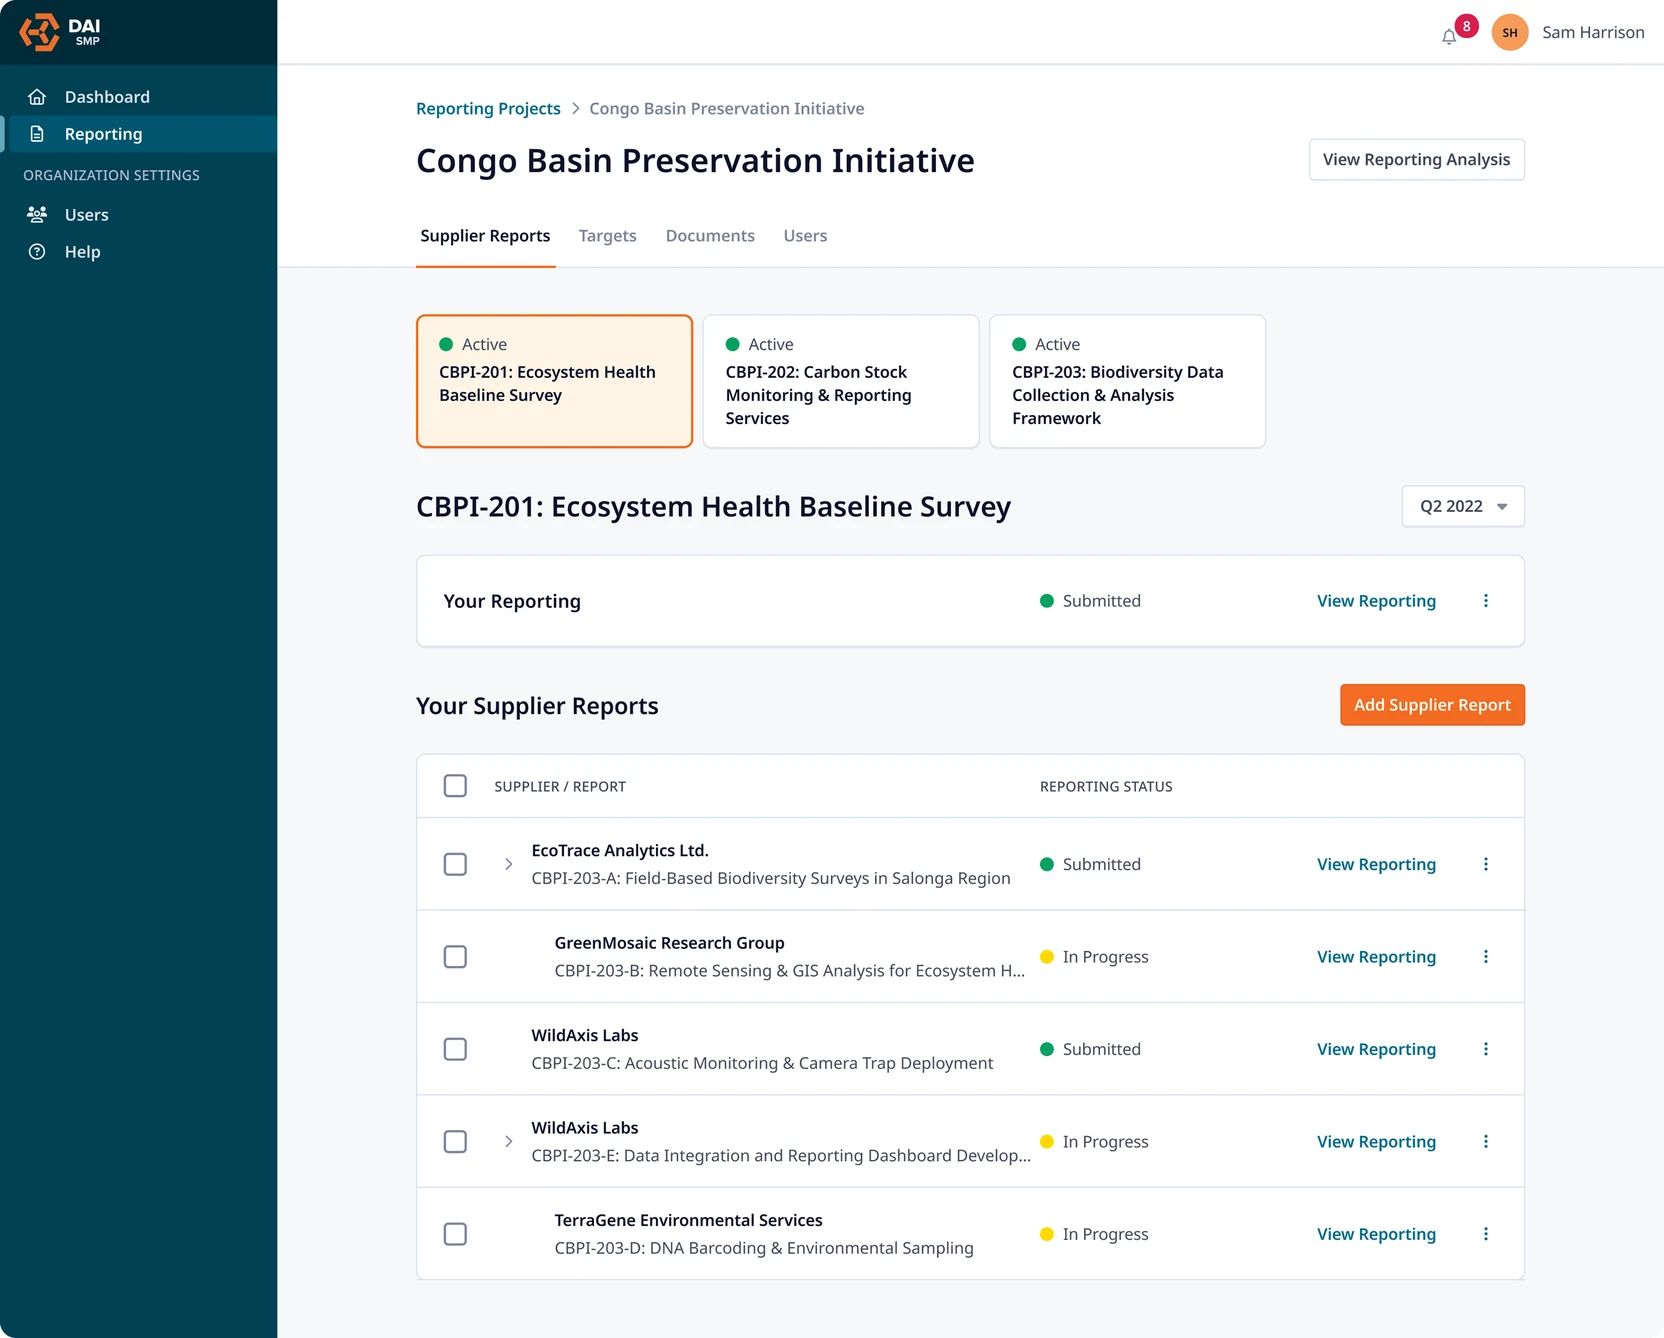
In large-scale project ecosystems, understanding the full local content landscape of the supply chain is critical. We designed an interface that clearly visualizes any buyer’s complete downstream supply chain, across all tiers and reporting periods. The local content compliance experts at buyer organizations can easily manage their supplier tree structure to fit the reporting reality and view submissions over time.
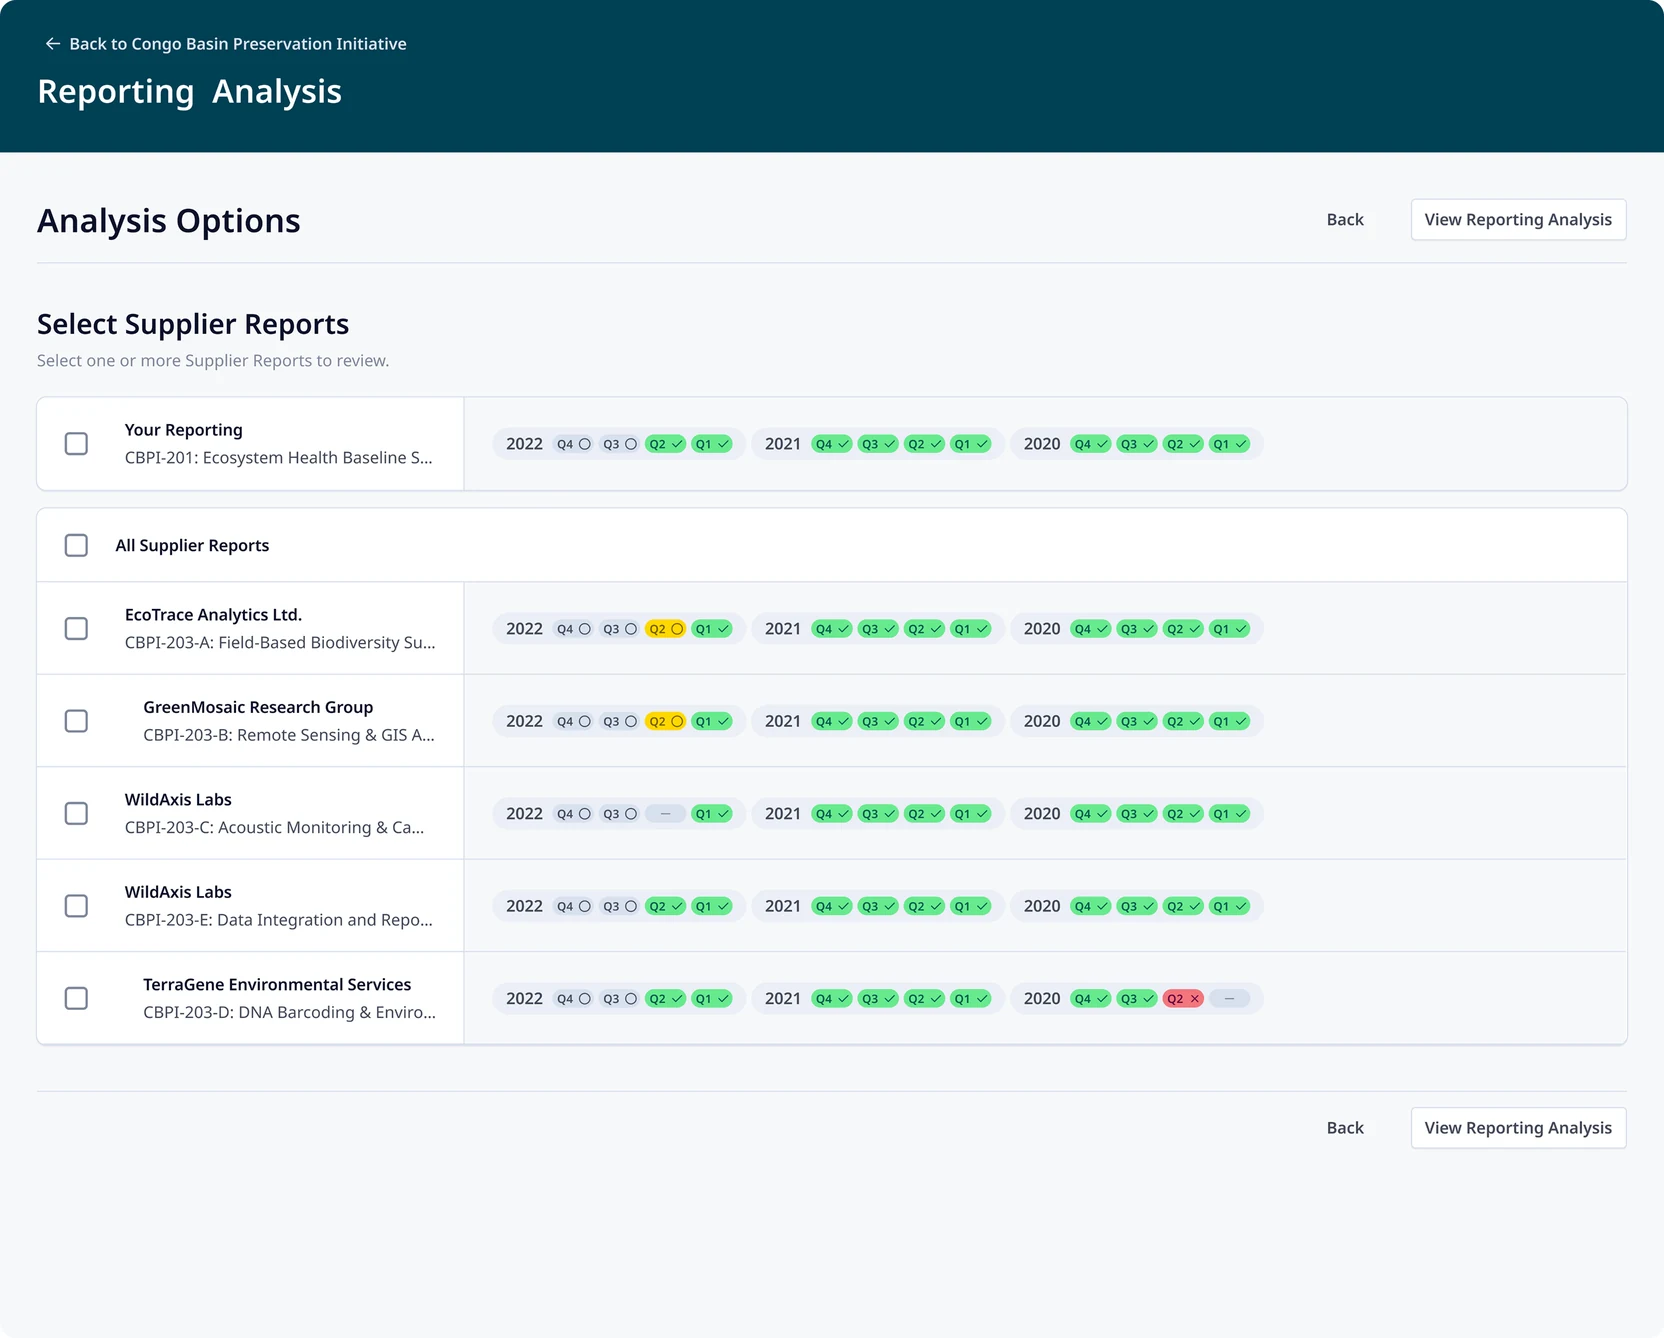
We creatively visualize the submission status of each supplier report in a given period during the buyer’s selection of the supplier reports for aggregation. Buyer users now just need to choose the reporting periods and supplier reports they want to aggregate to see a full local content report analysis.
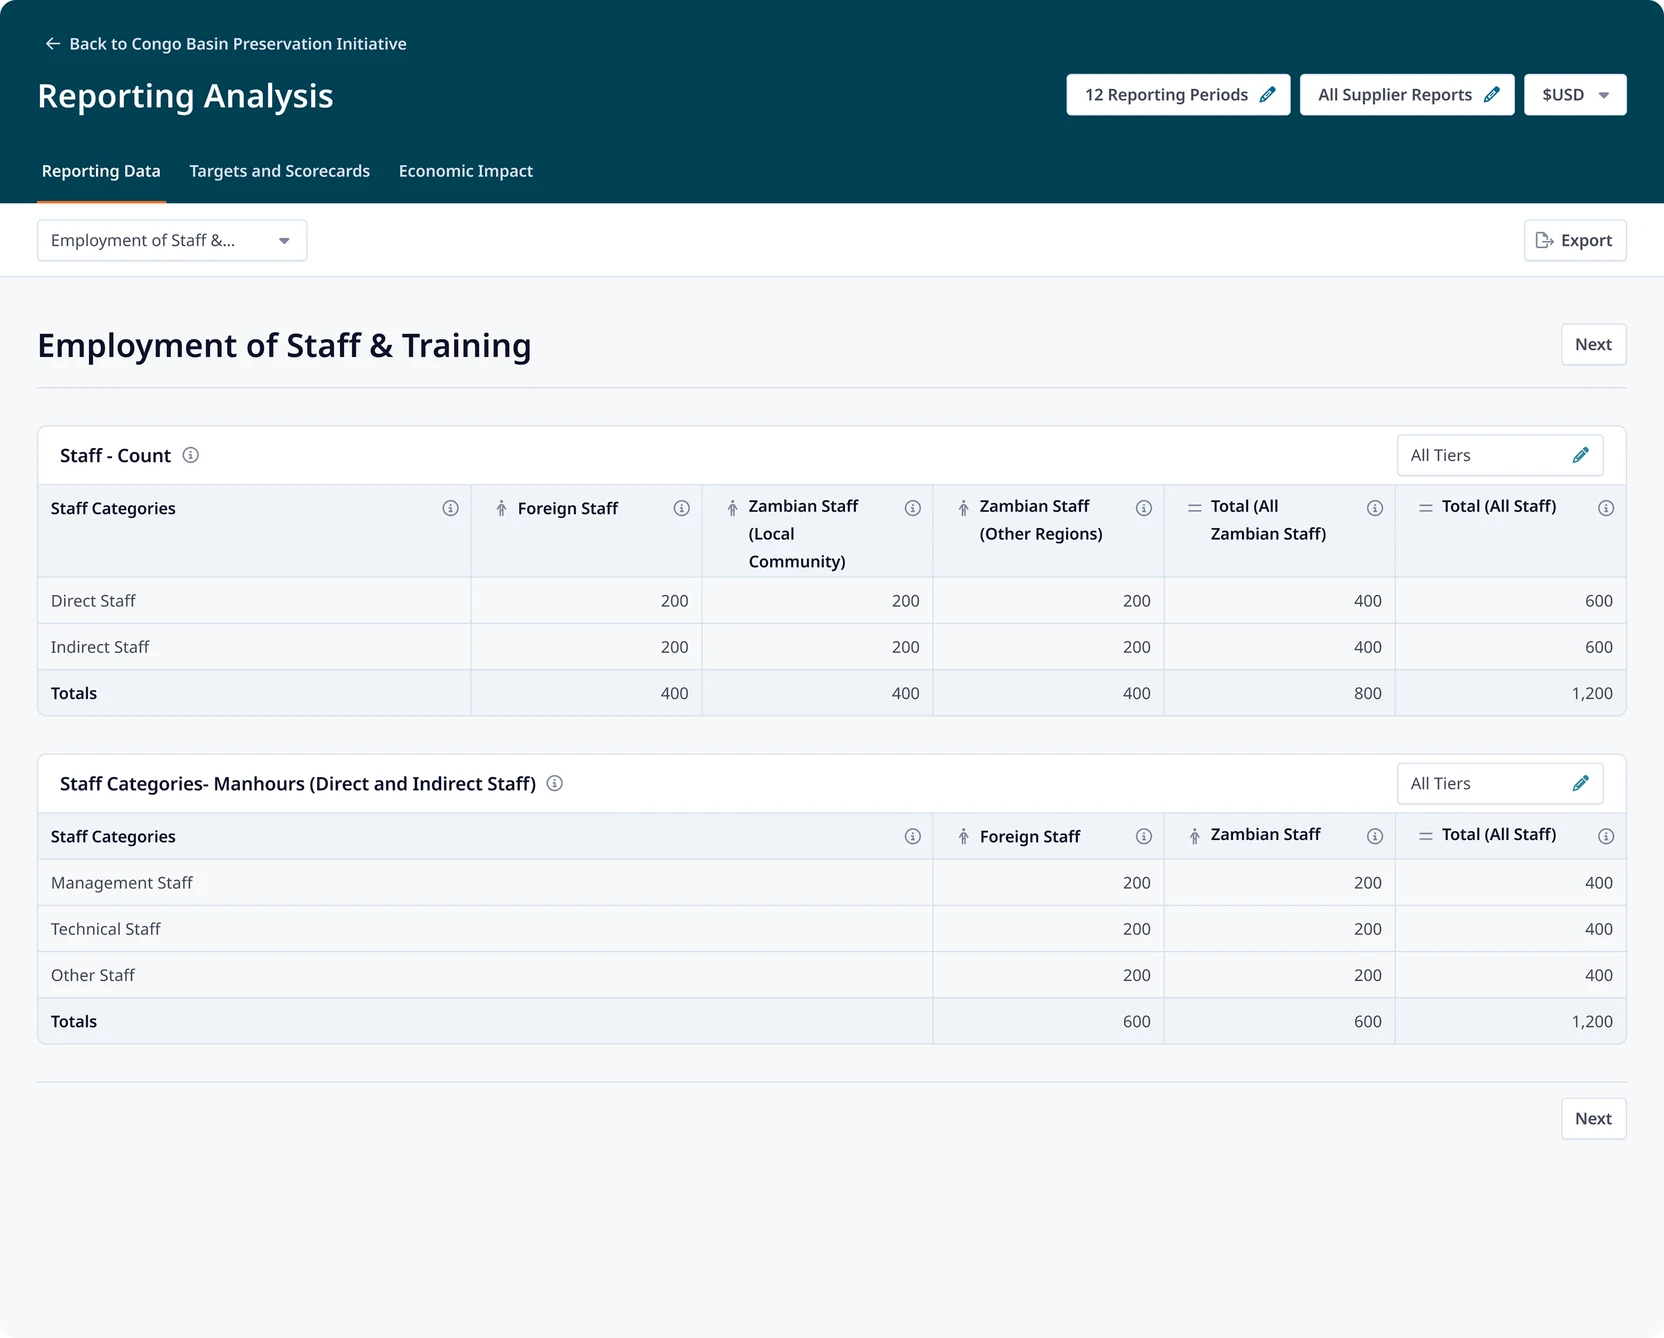
The result is that what used to be a completely manual and unstructured data aggregation process can be completed in a few clicks with our tool.
Making local content commitments visible, trackable, and actionable
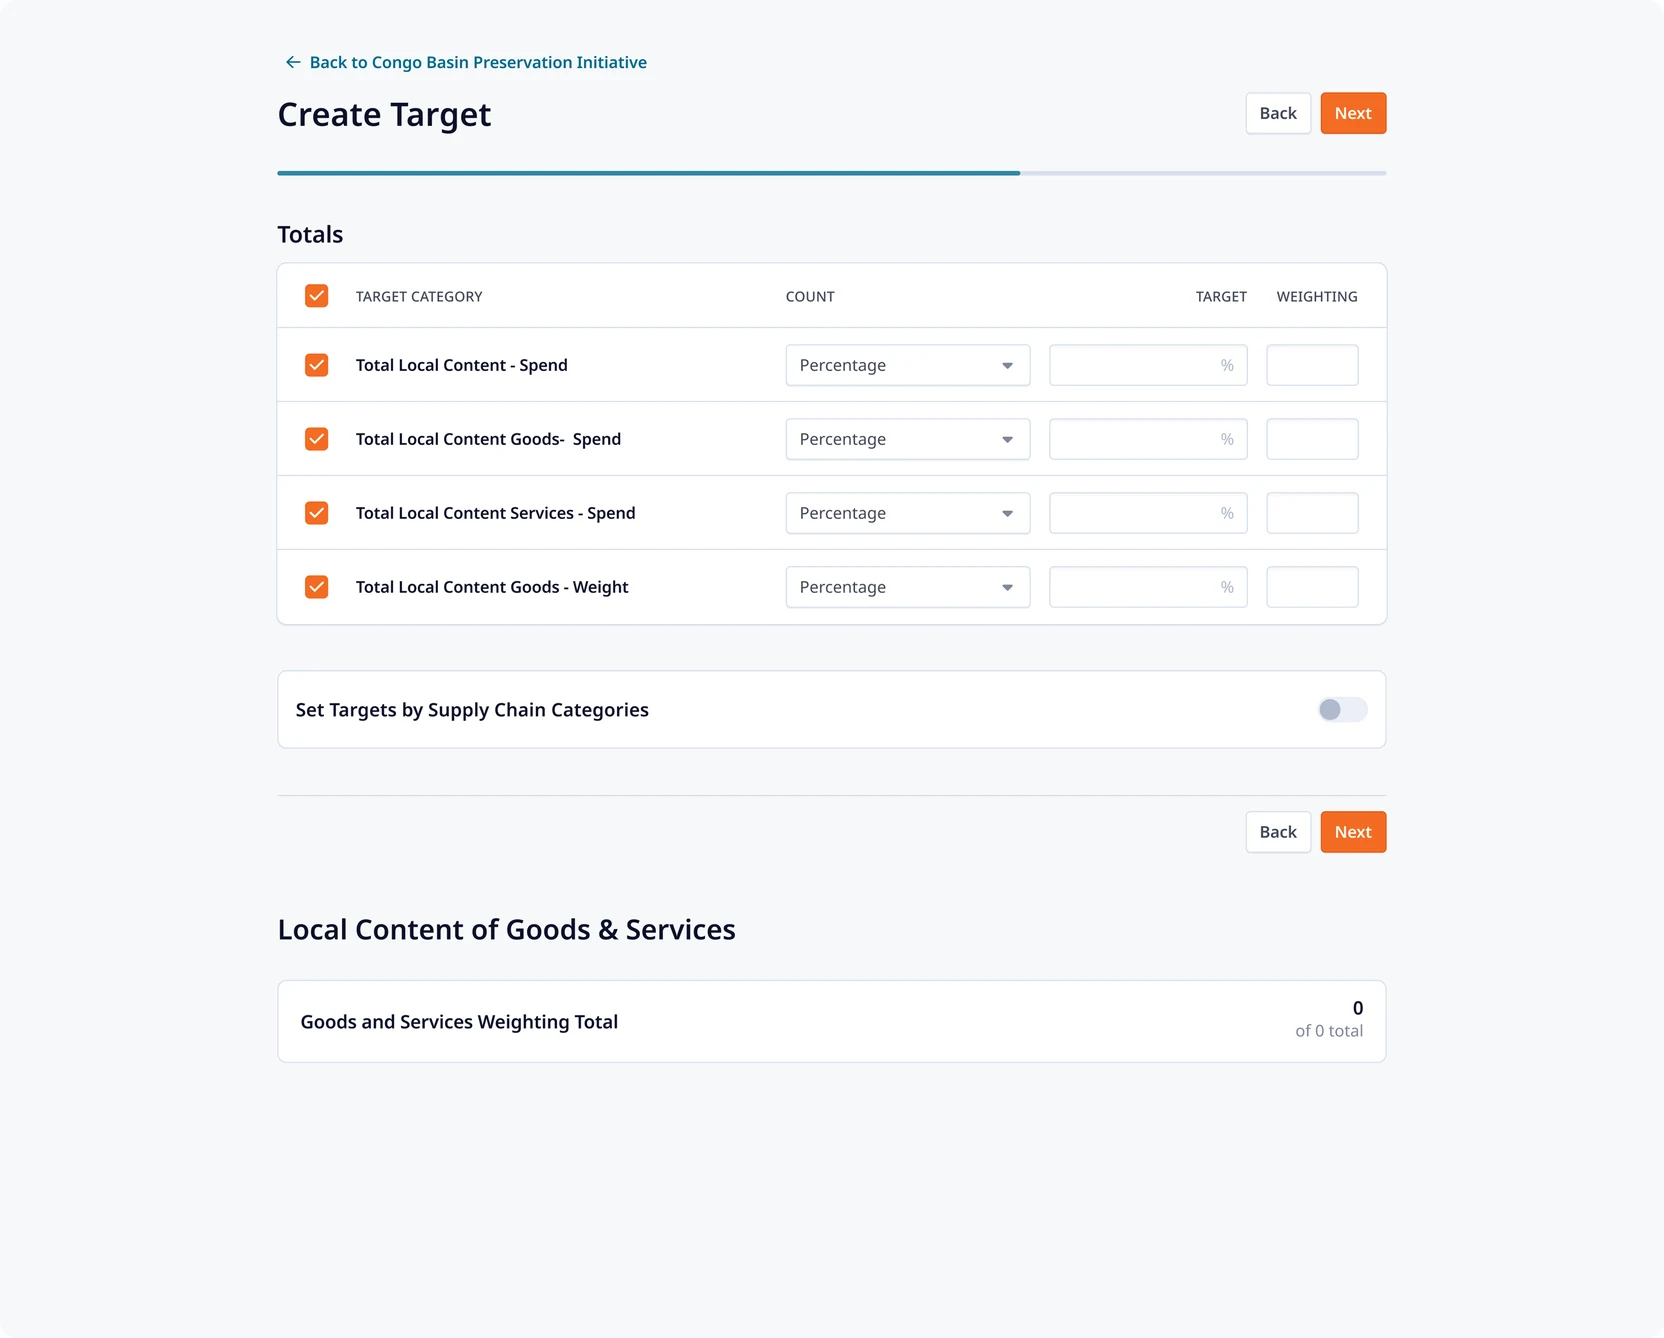
In many projects, buyers are accountable to the national or local government of the region in which they operate and must demonstrate that they’re meeting commitments to hire locally and purchase from local suppliers. The Target feature in SMP was designed to bring clarity and structure to this process. Buyers can now easily create specific local content targets by category, such as spend, workforce, or goods weight, tailored to different supply chain sectors.
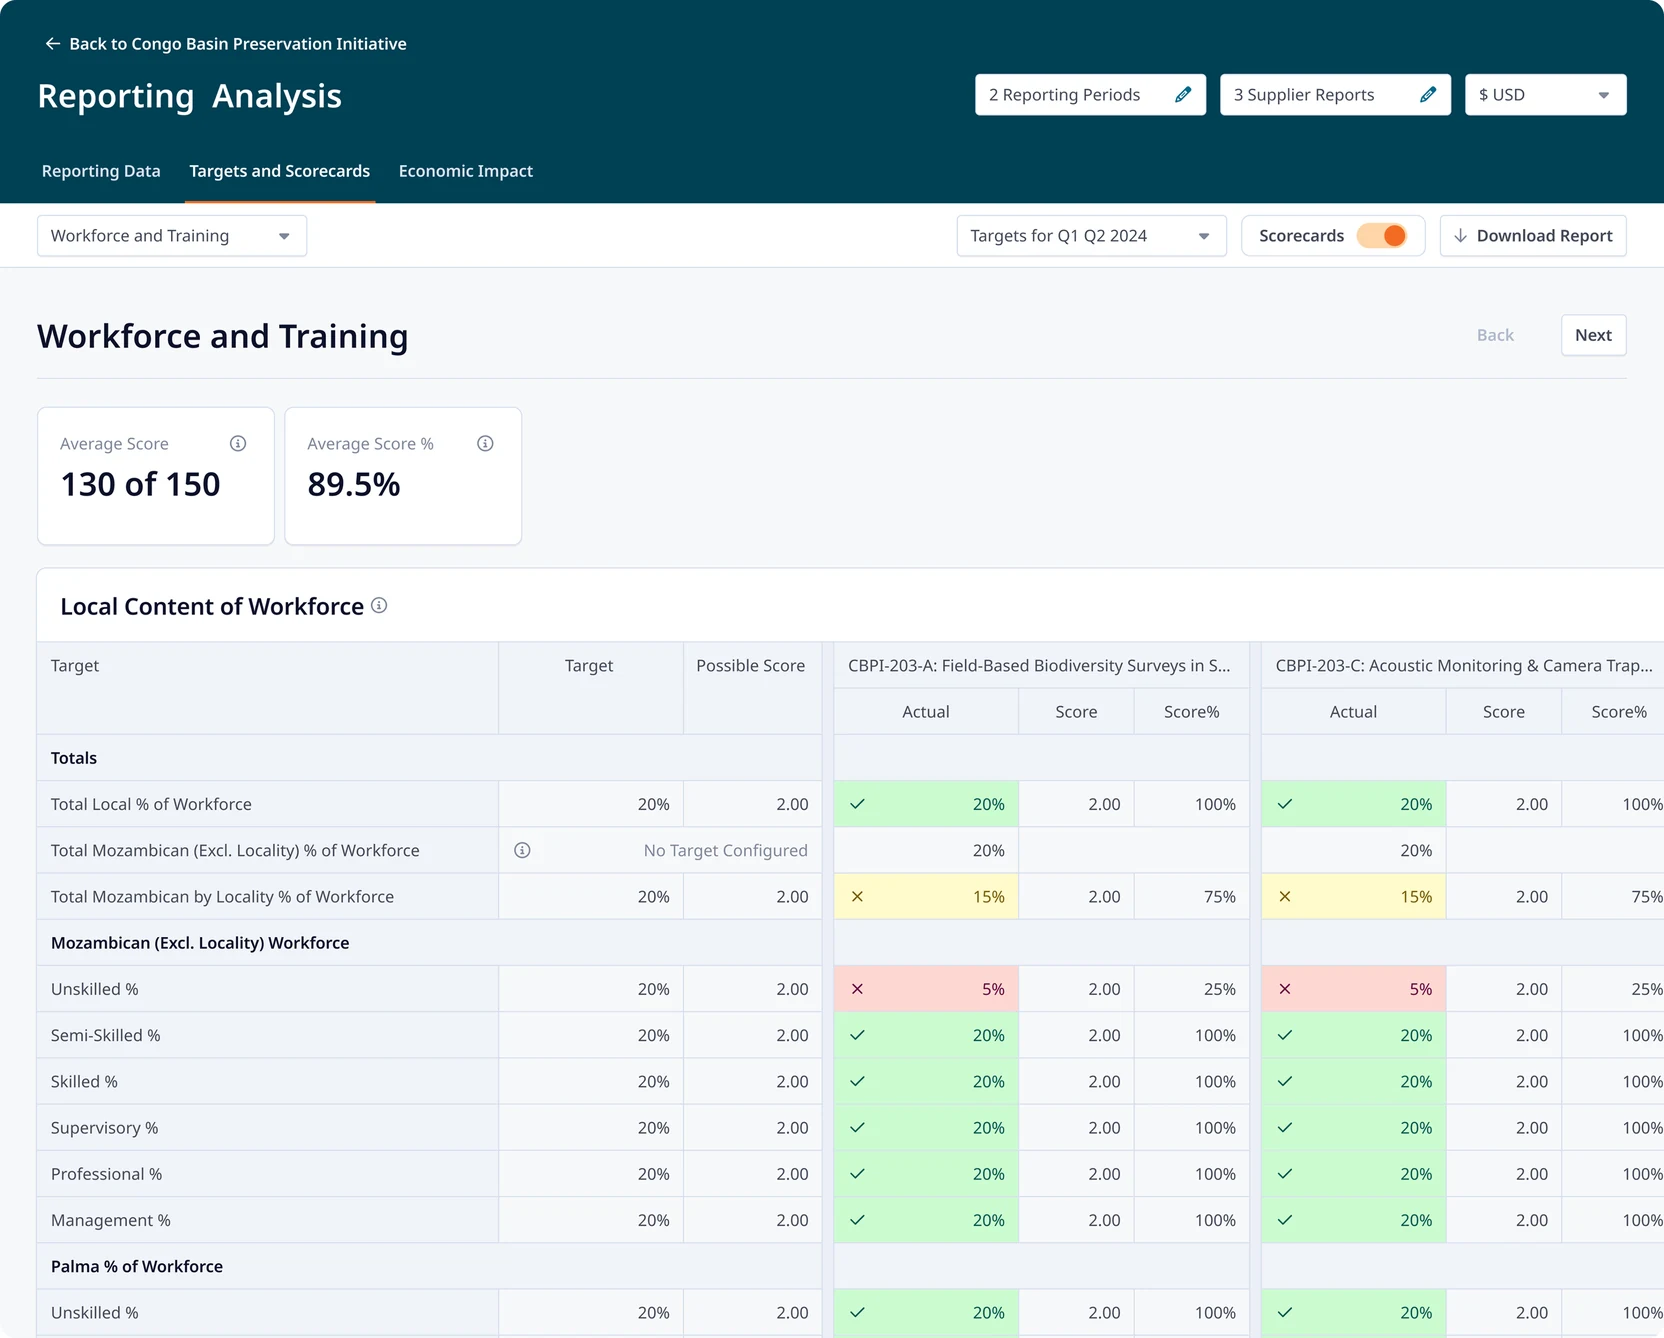
To support accountability, these targets are seamlessly integrated into the Reporting Analysis view. Buyers can instantly see how they and suppliers are performing against predefined targets across reporting periods.
Aggregated data powers clear scorecards, reducing complexity and enabling buyers to focus on strategic decisions rather than manual tracking. The result is a system that not only makes target setting easy, but turns it into an actionable part of daily operations.
Turning data into impact stories
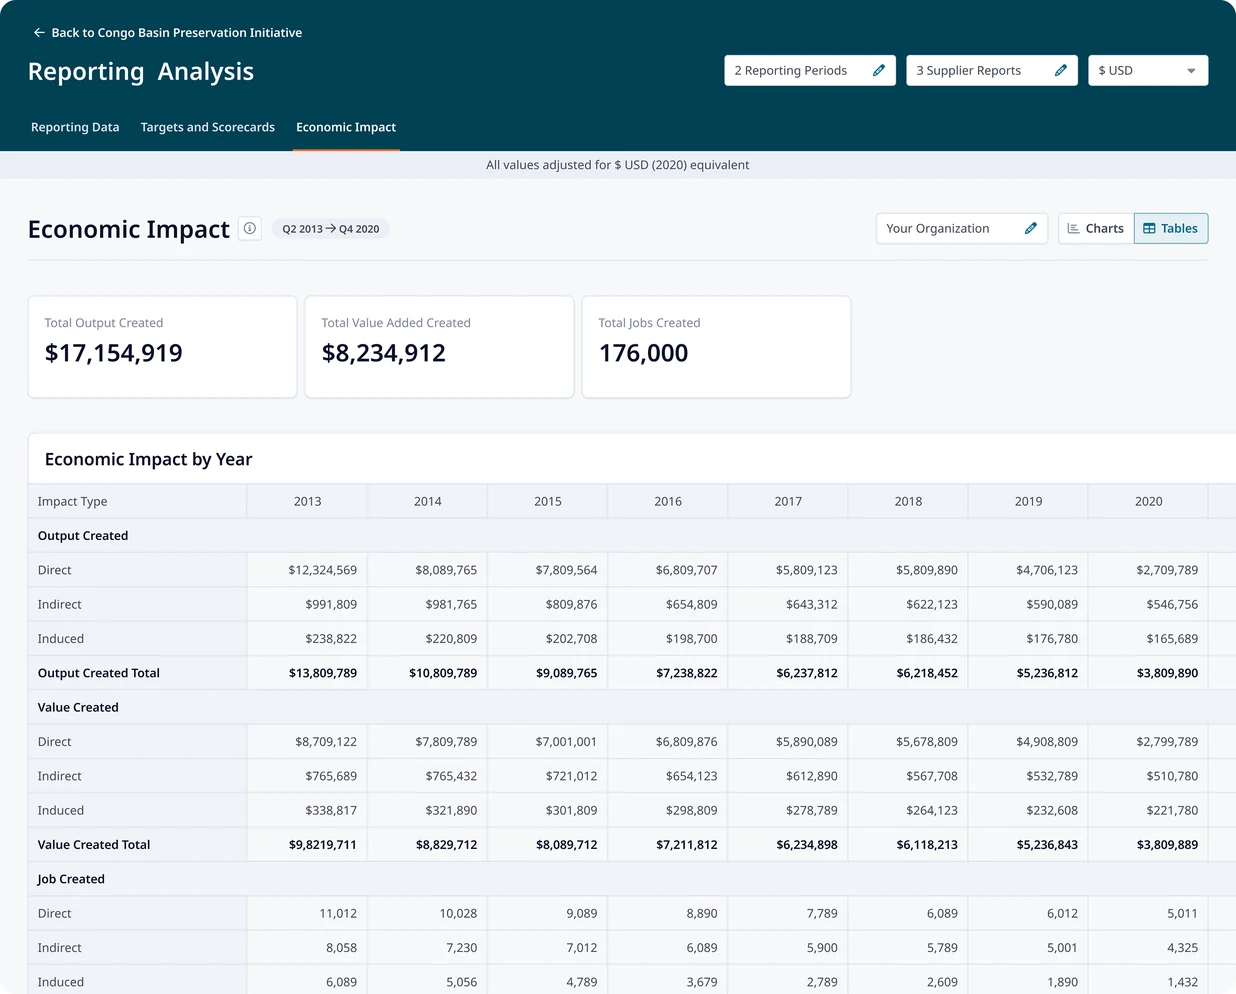
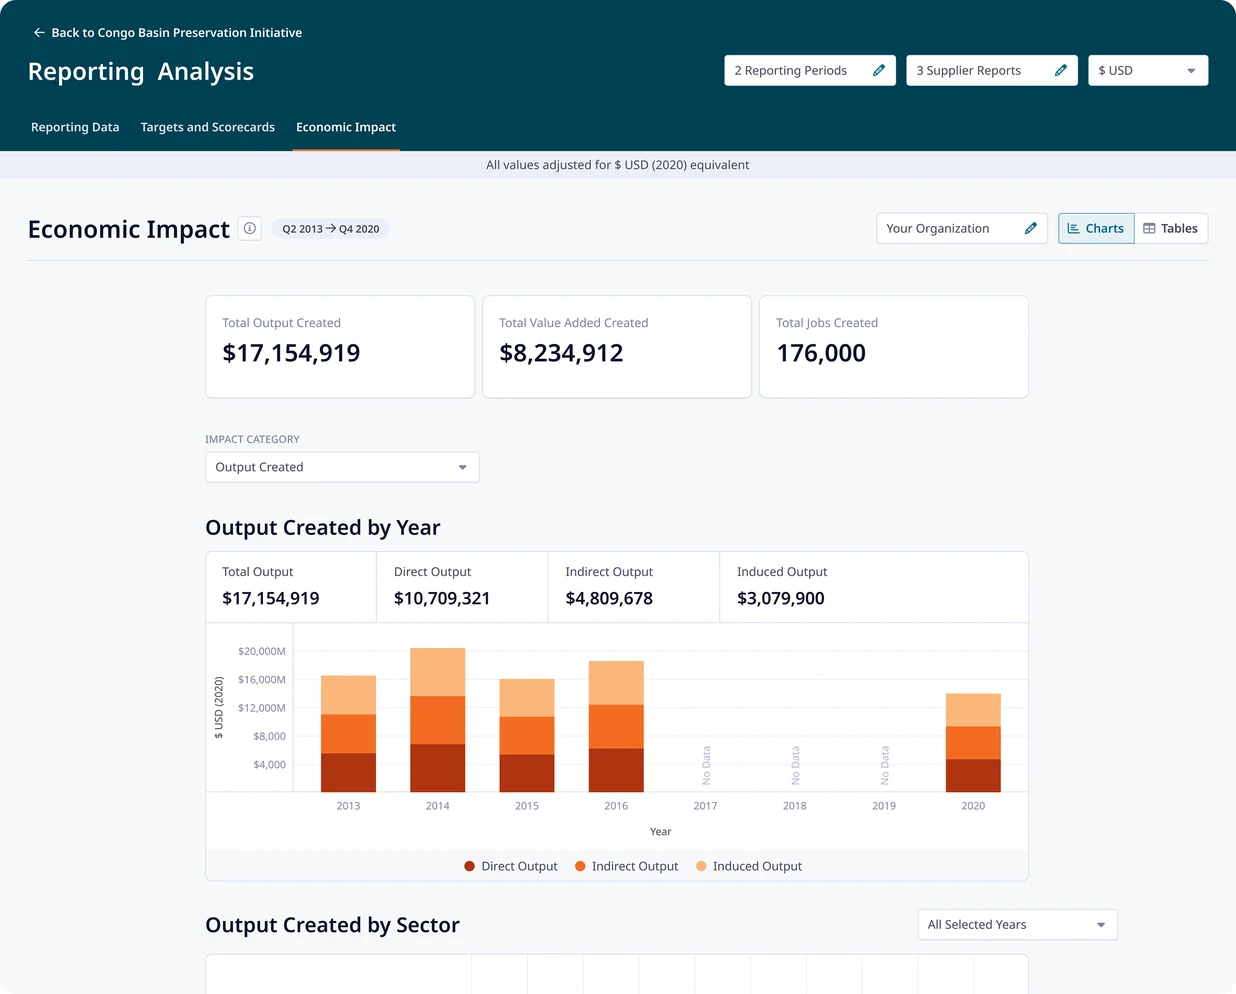
Local authorities often ask a simple question: What difference did this project make to the local economy?
The Economic Impact module makes that answer to that question clear. Seamlessly integrated into the Reporting Analysis experience, it reveals the footprint of the operation, showing the jobs supported, value created, and output generated across the supply chain over a certain period of time. Presented in clean charts and structured tables, the data speaks clearly.
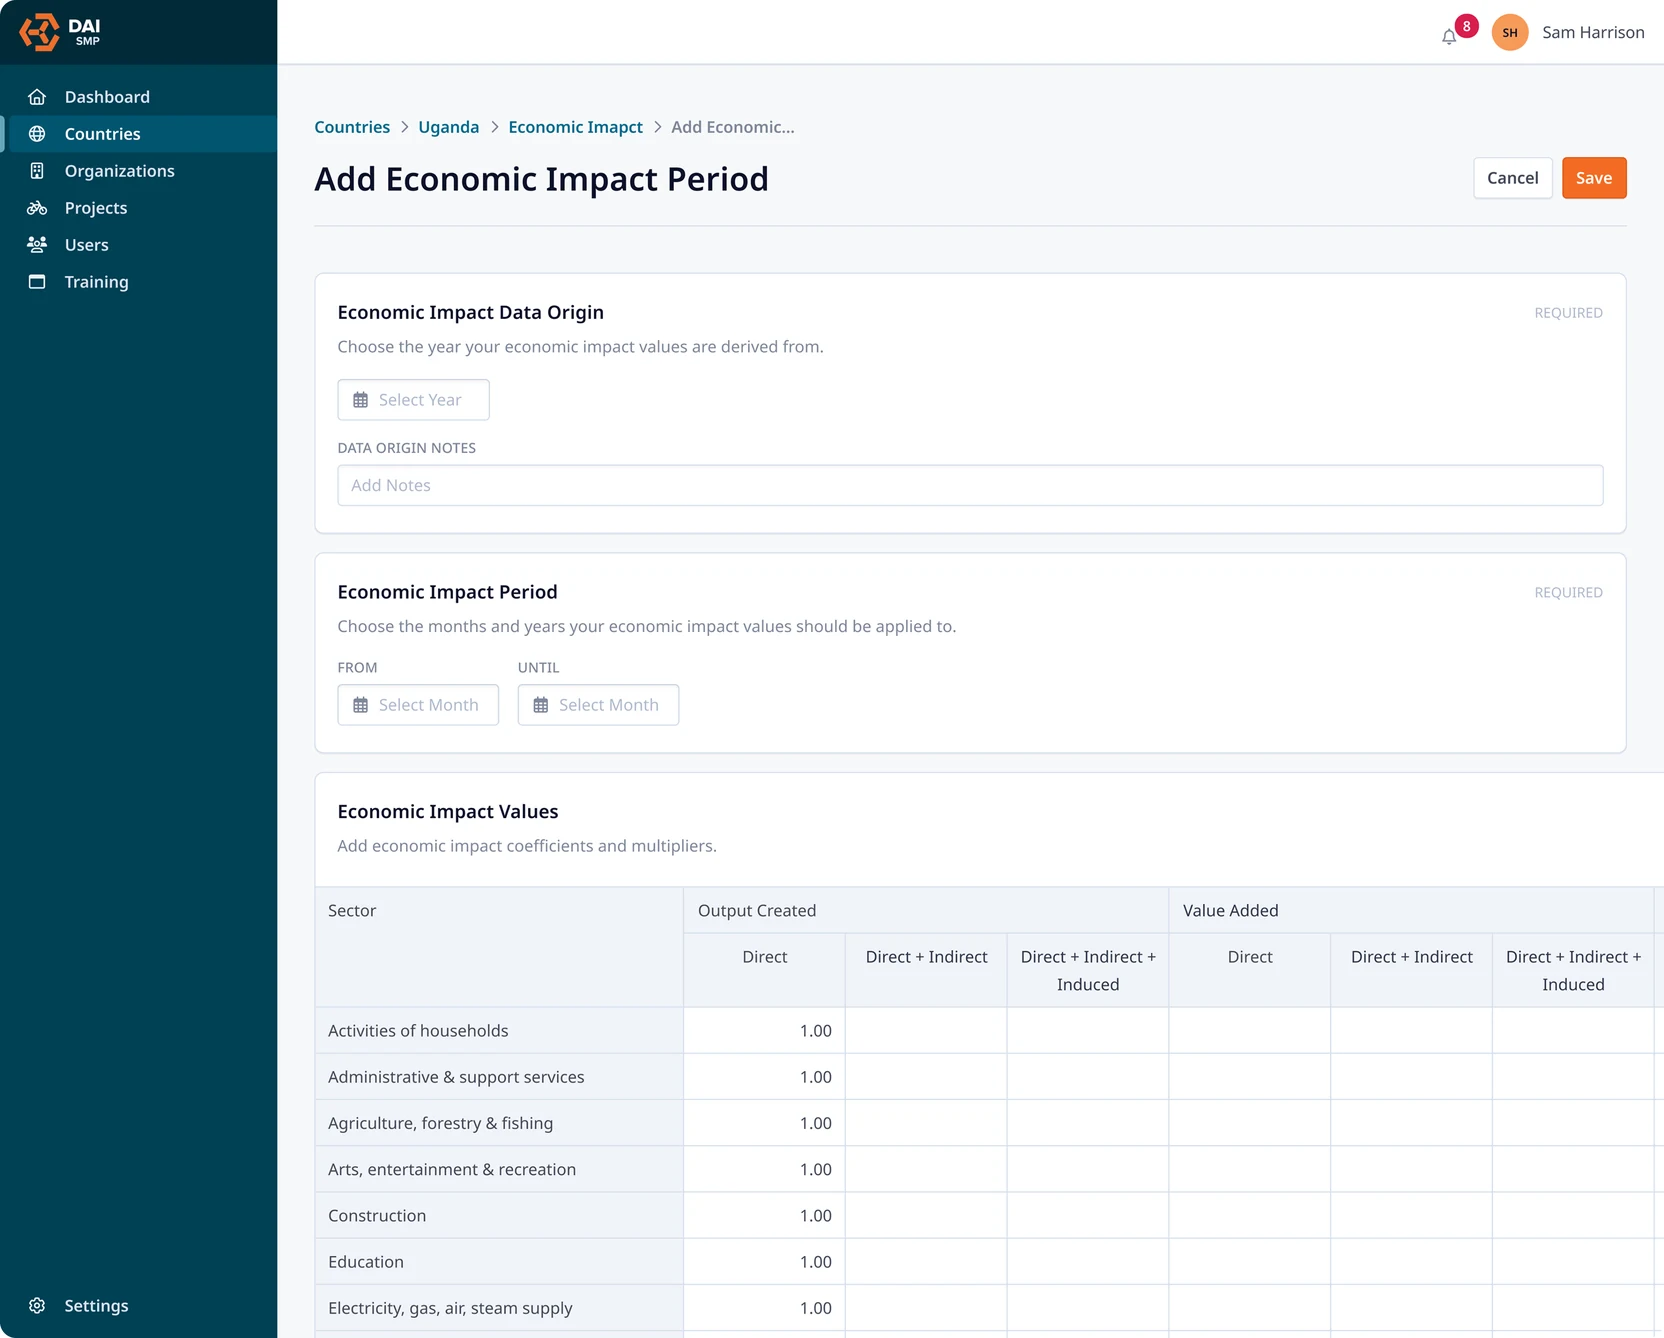
Behind the scenes, the calculations are powered by a model developed by DAI’s team of international development economists. Because no two regions are the same, we built flexibility into the admin settings, allowing teams to adjust coefficients and tailor the model to local realities.
Real-time visibility into local content oversight
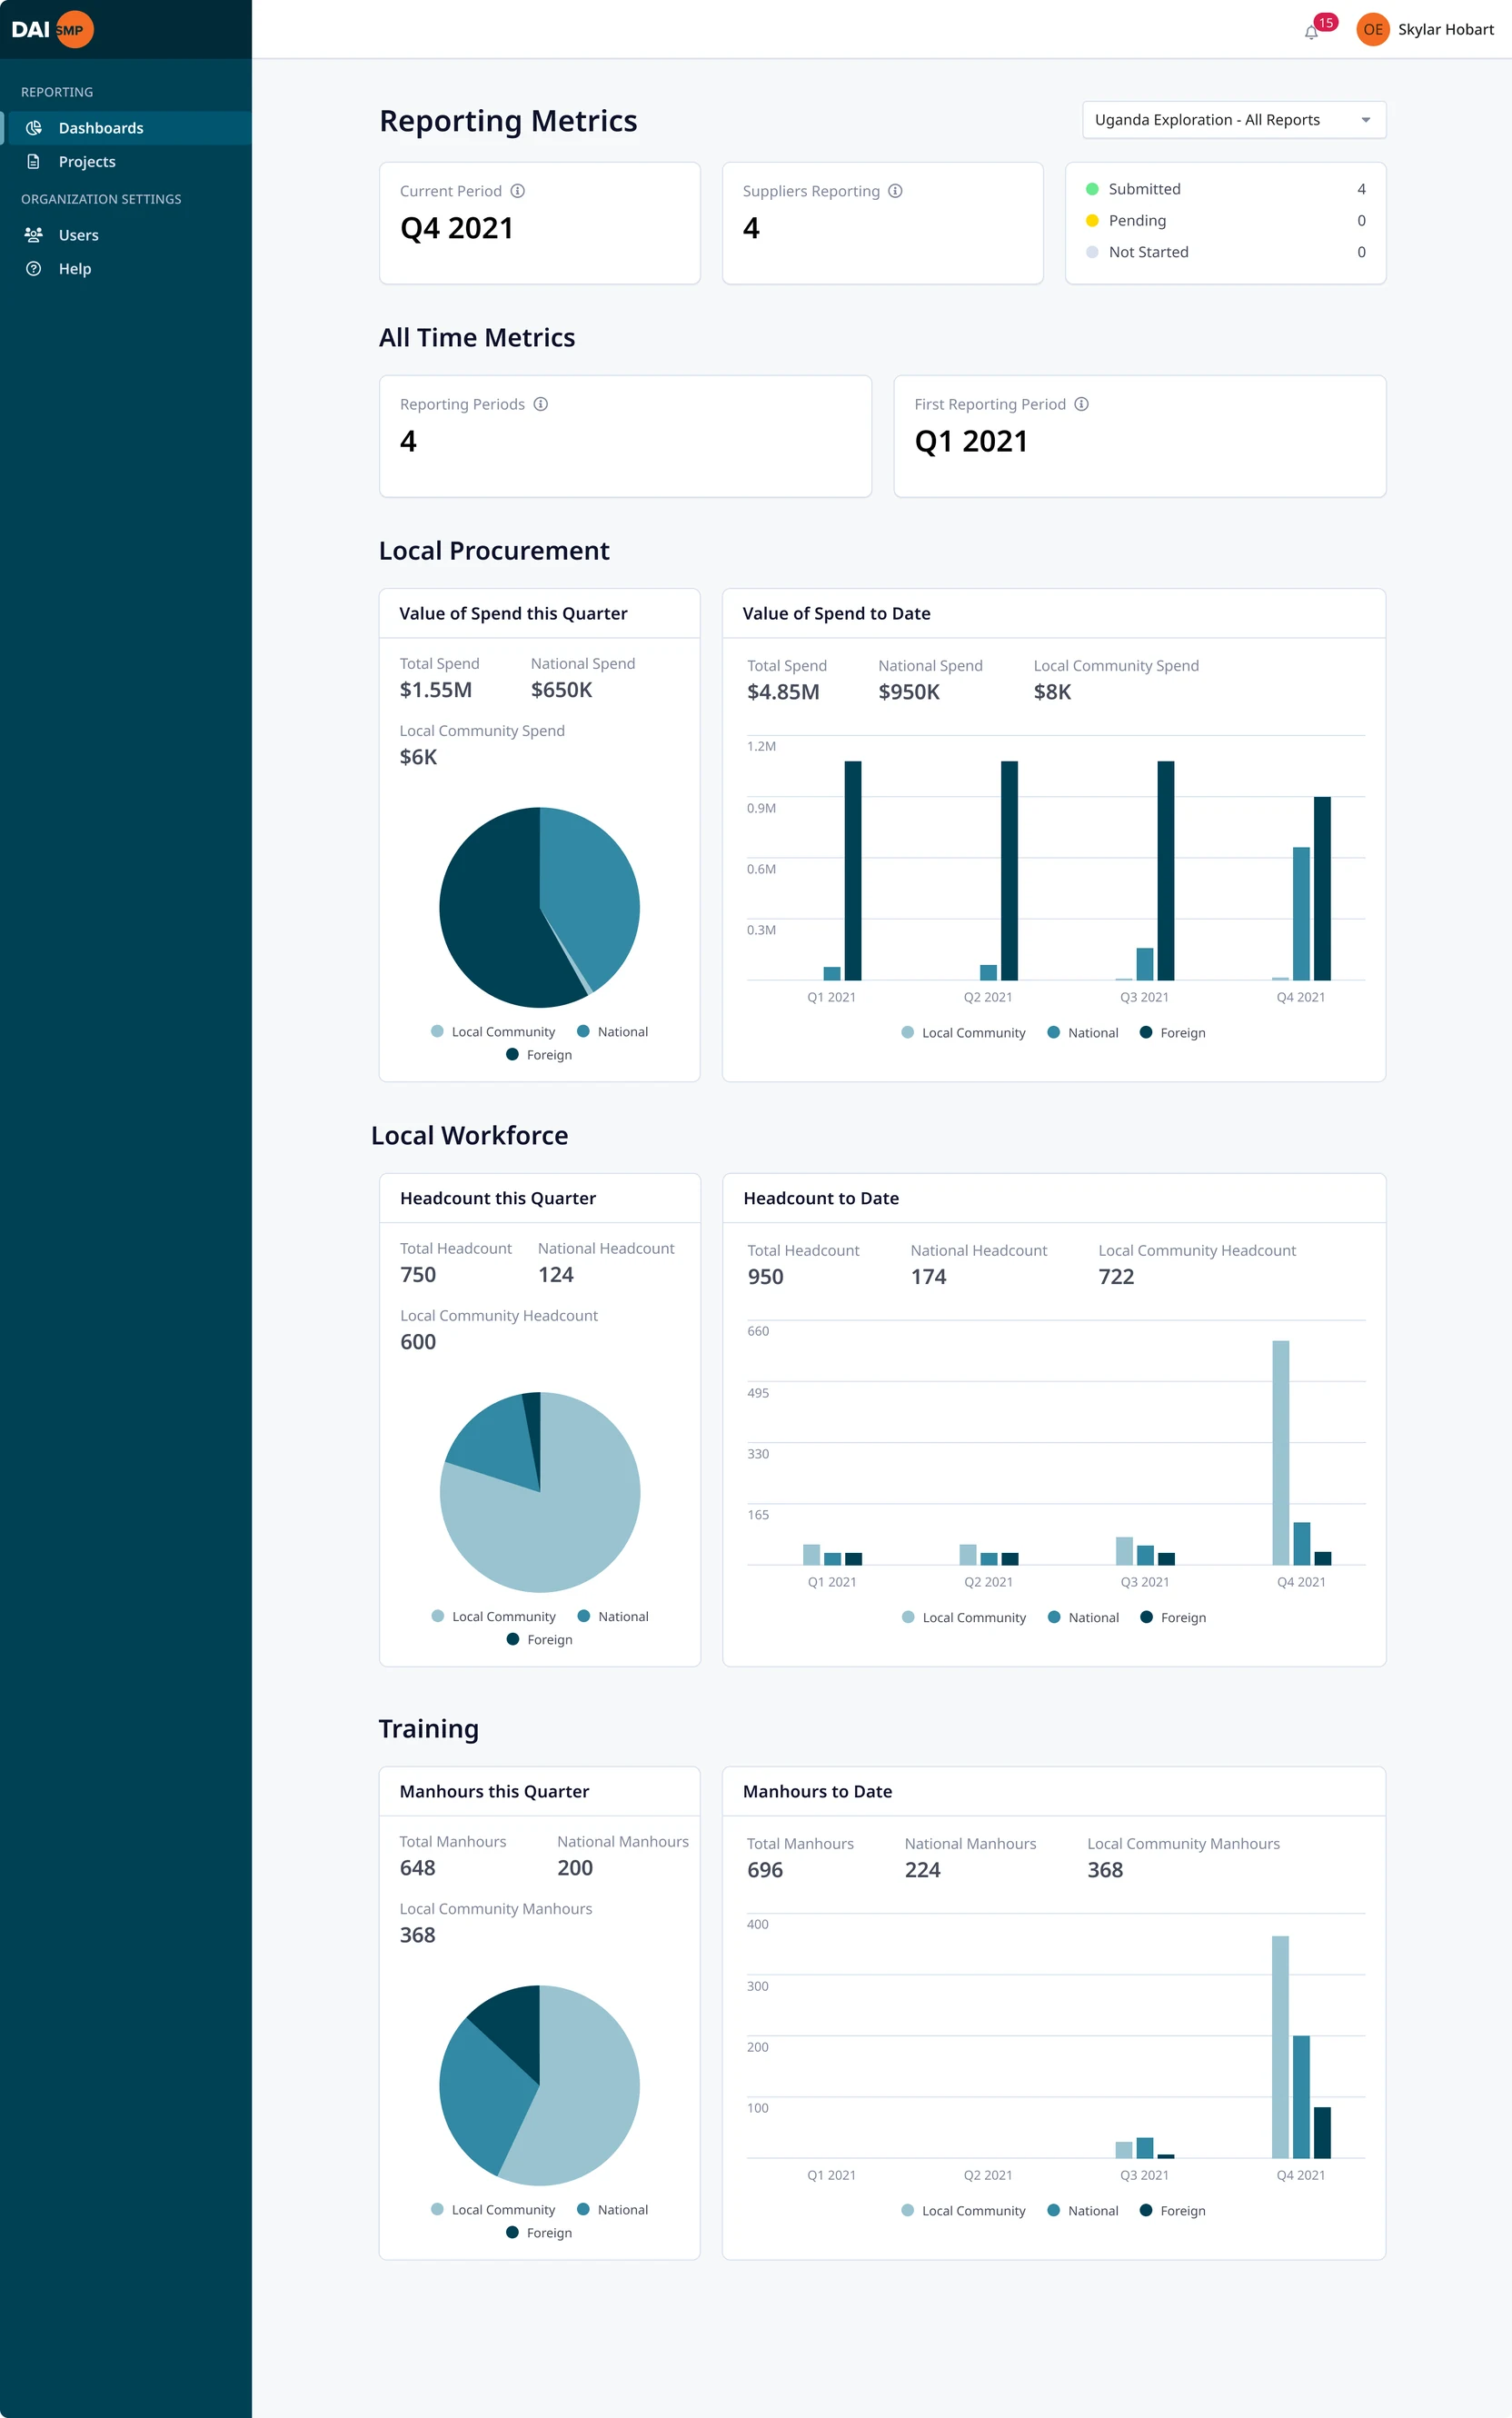
The dashboard helps buyers monitor supplier reporting and track spending across local, national, and foreign sources. With live status updates and visual breakdowns, it's easy to measure progress, identify gaps, and demonstrate compliance.
Built for flexibility at scale
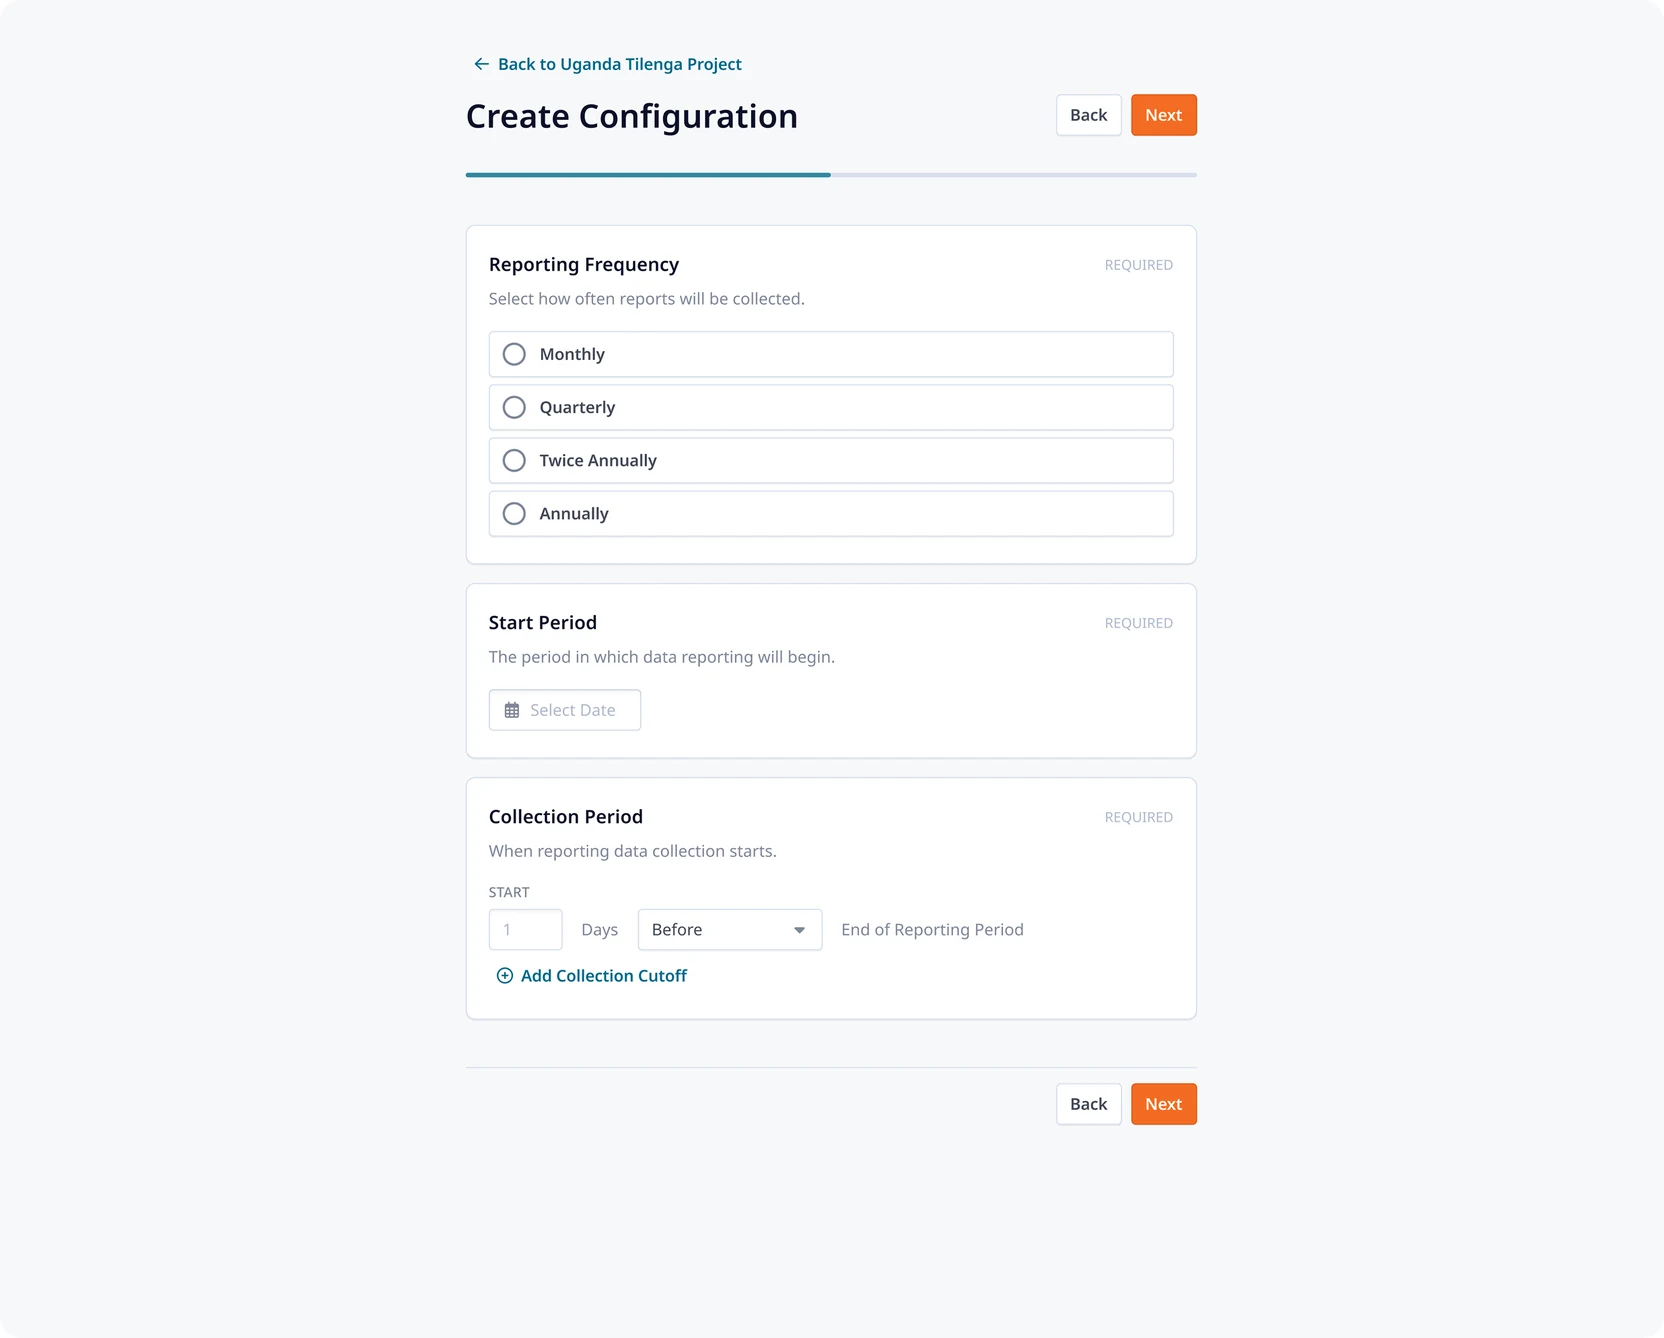
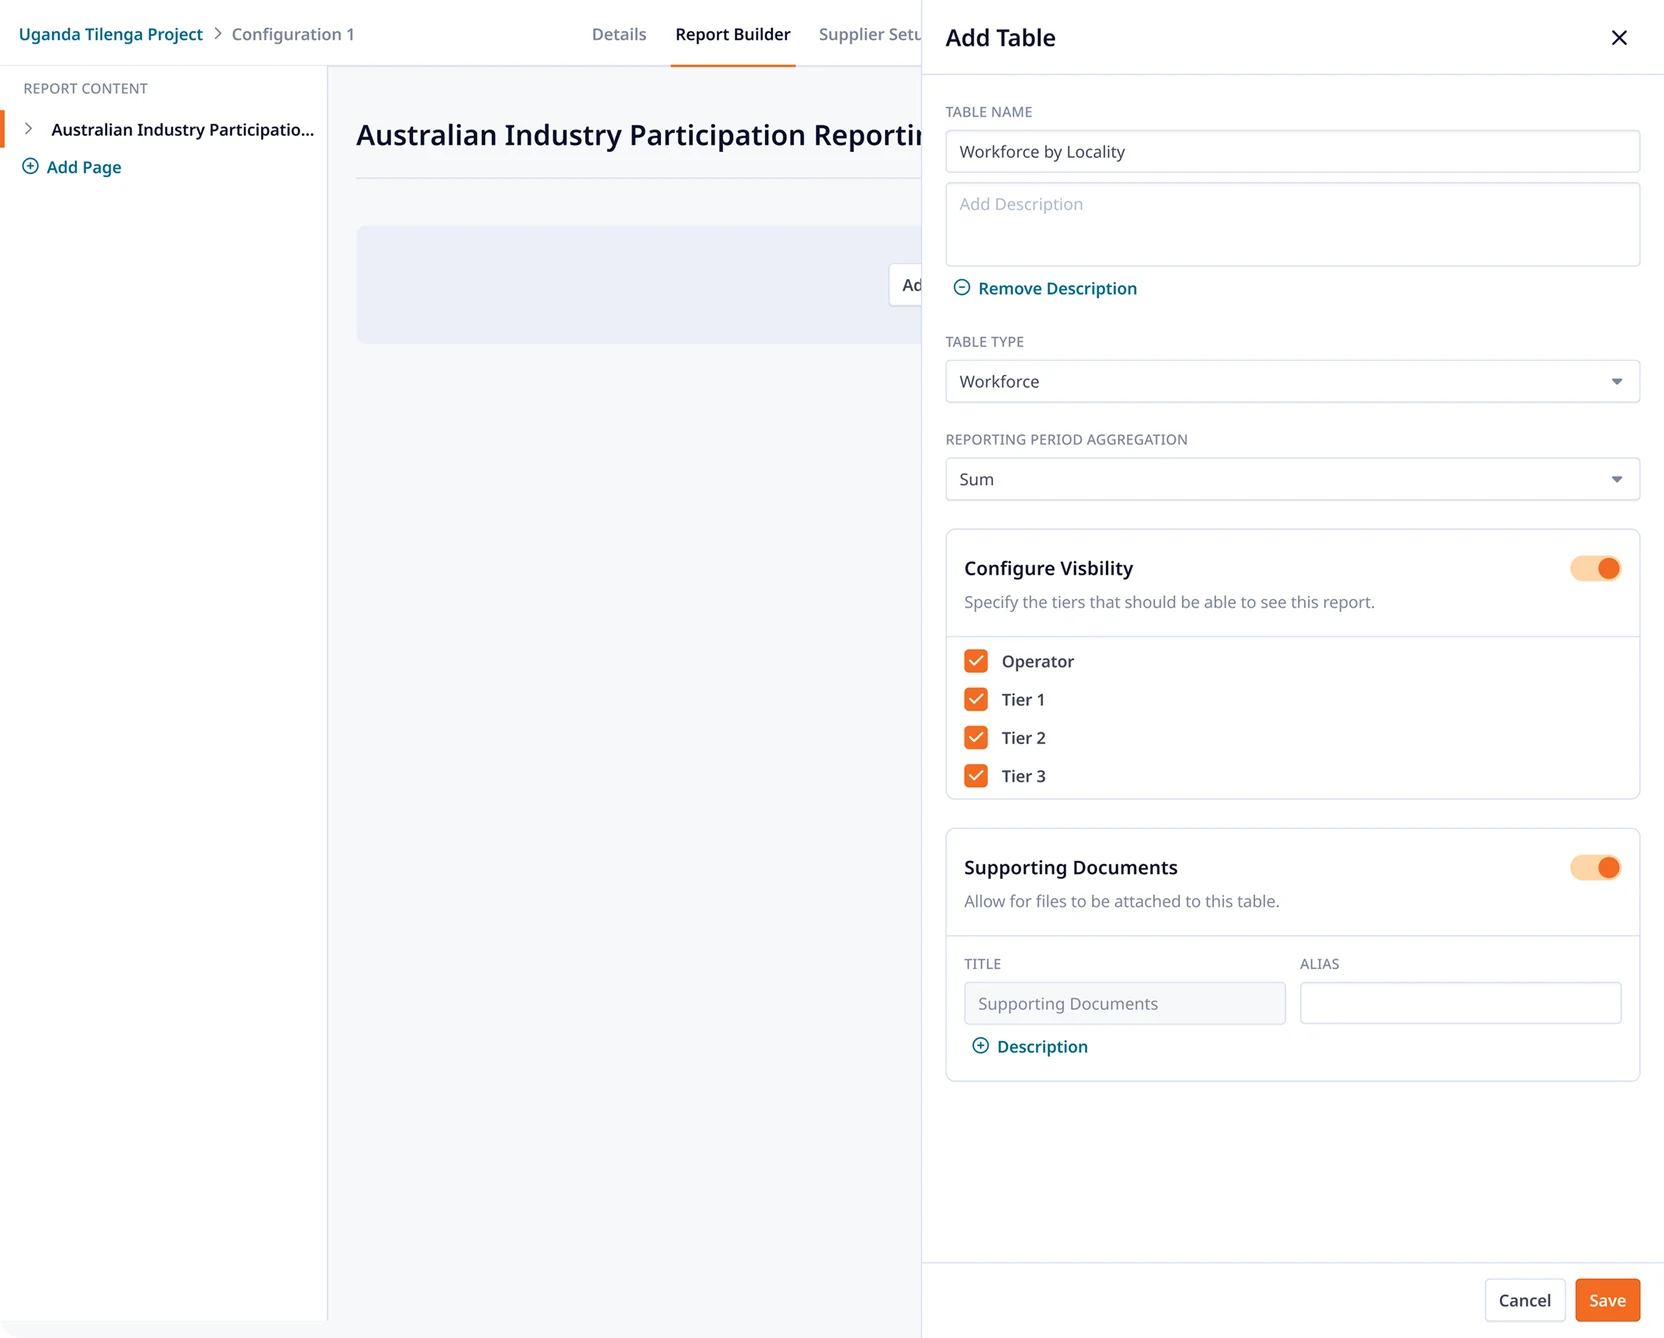
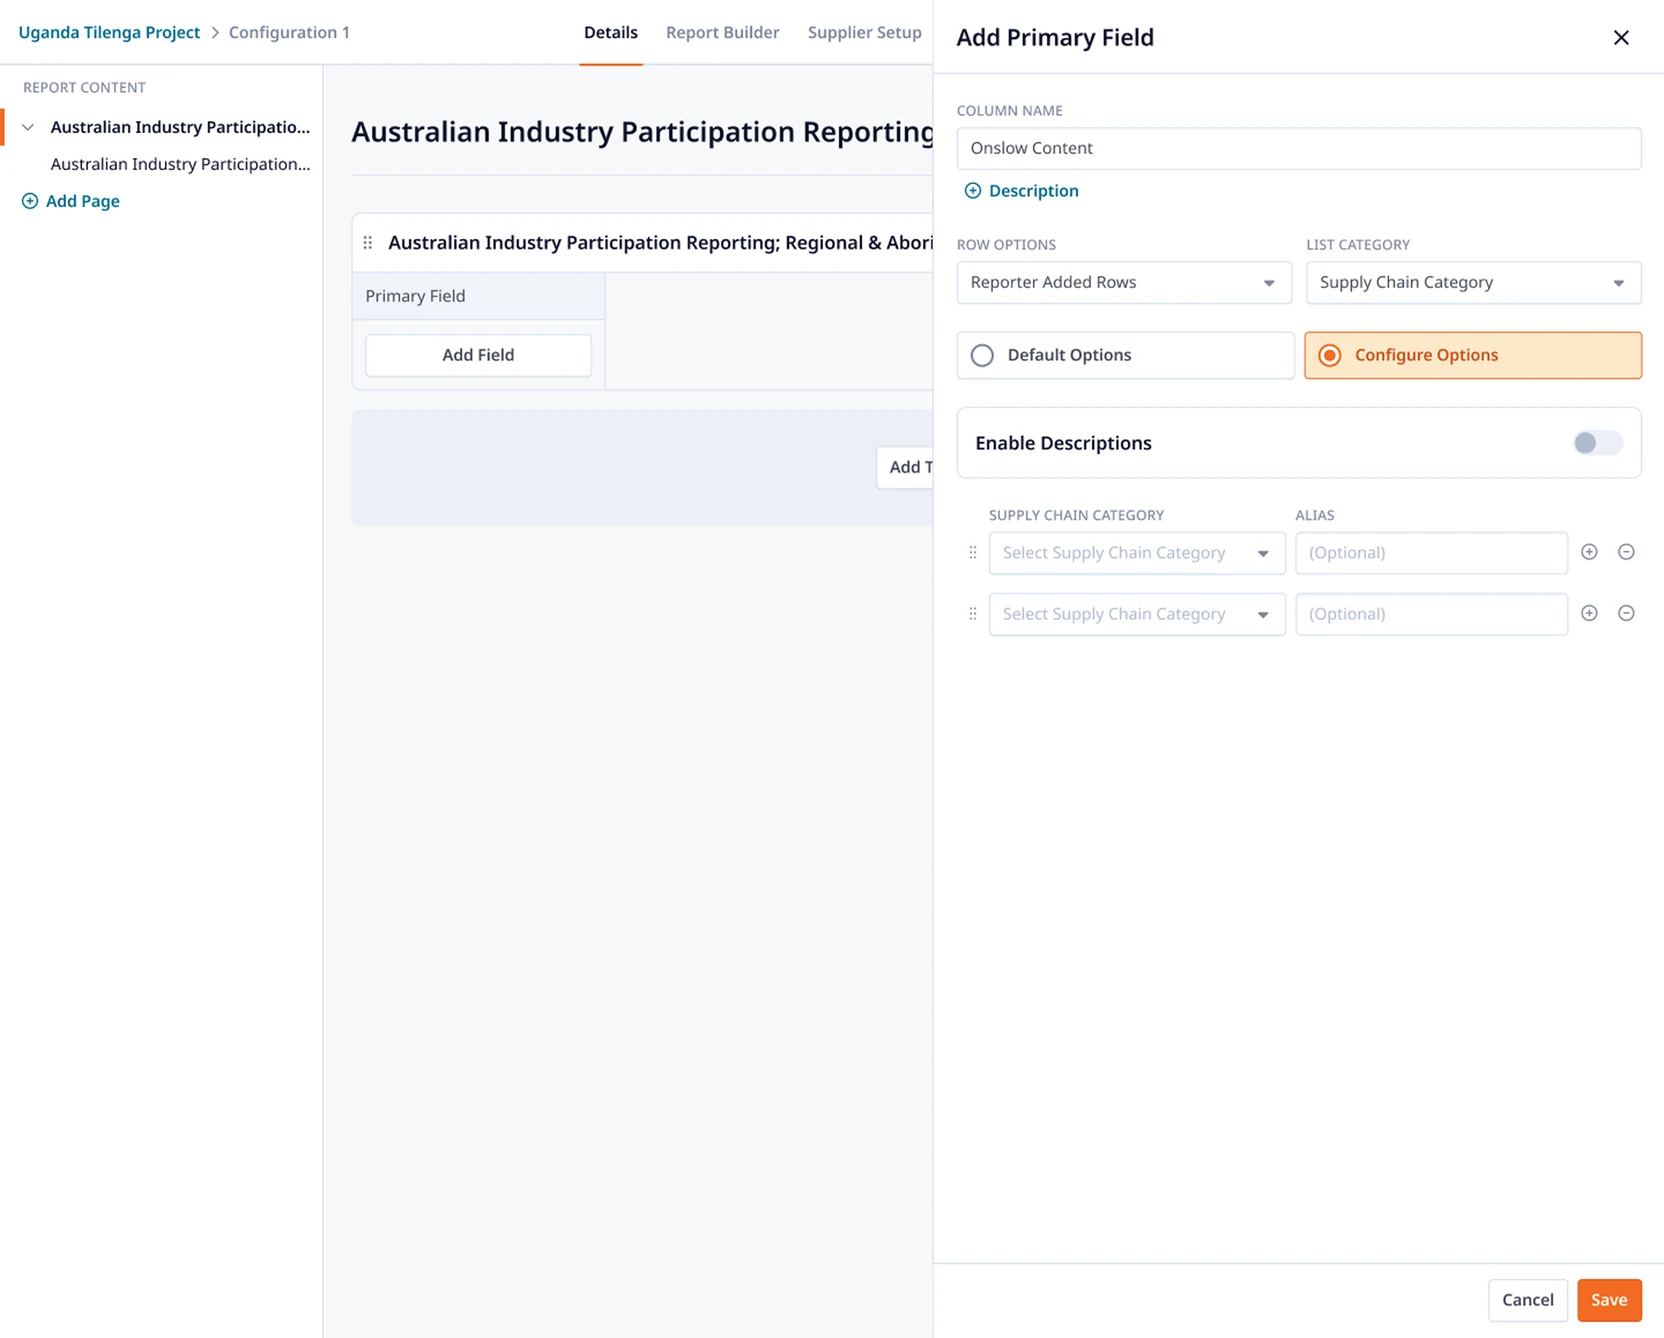
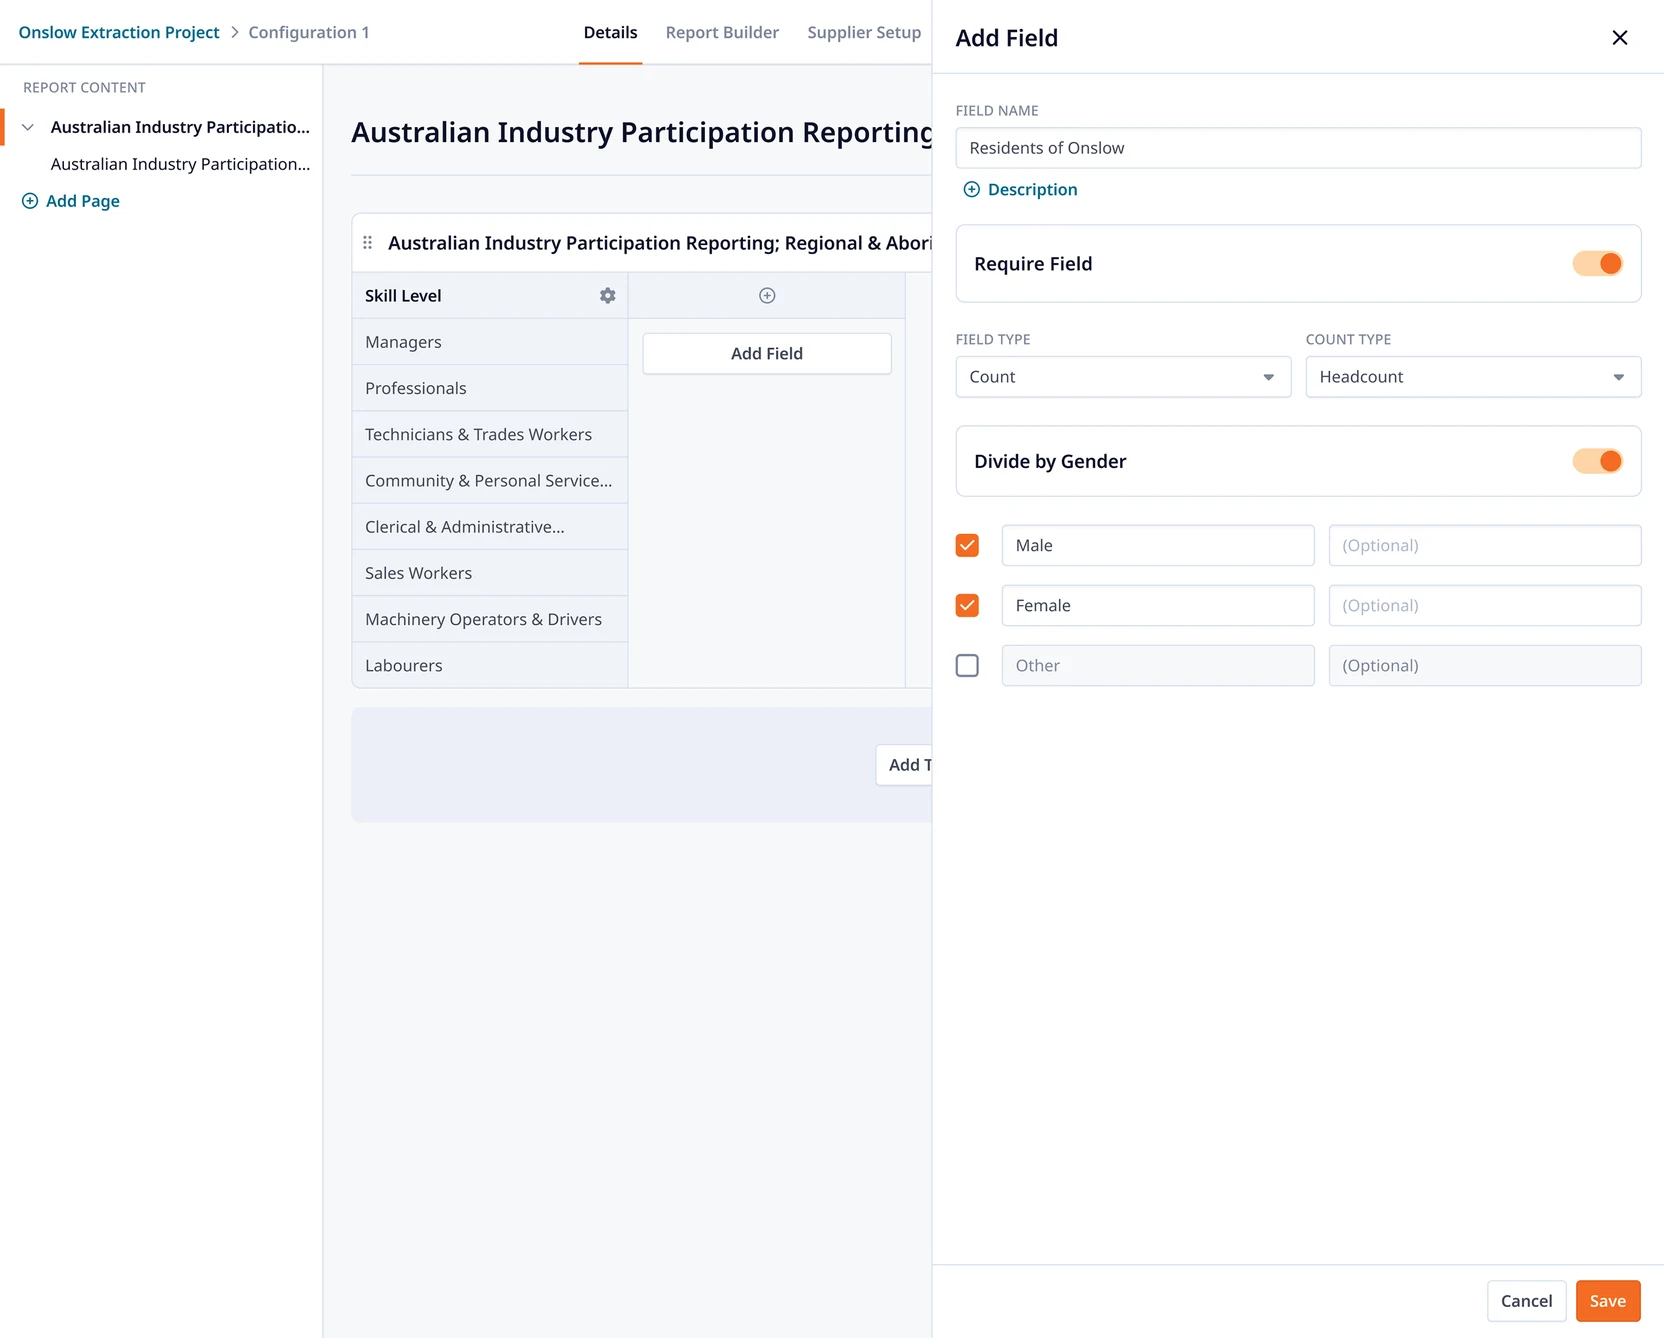
Reporting needs change: from one region to another, and over time. To support this, we created Report Builder: a fully configurable, no-code tool that enables the DAI team to define reporting structures without requiring developer support.
Everything is adjustable: reporting frequency, cutoff dates, table formats, and fields. Columns can capture any data type, from simple counts to multi-select inputs, with aggregation logic defined at the table level.
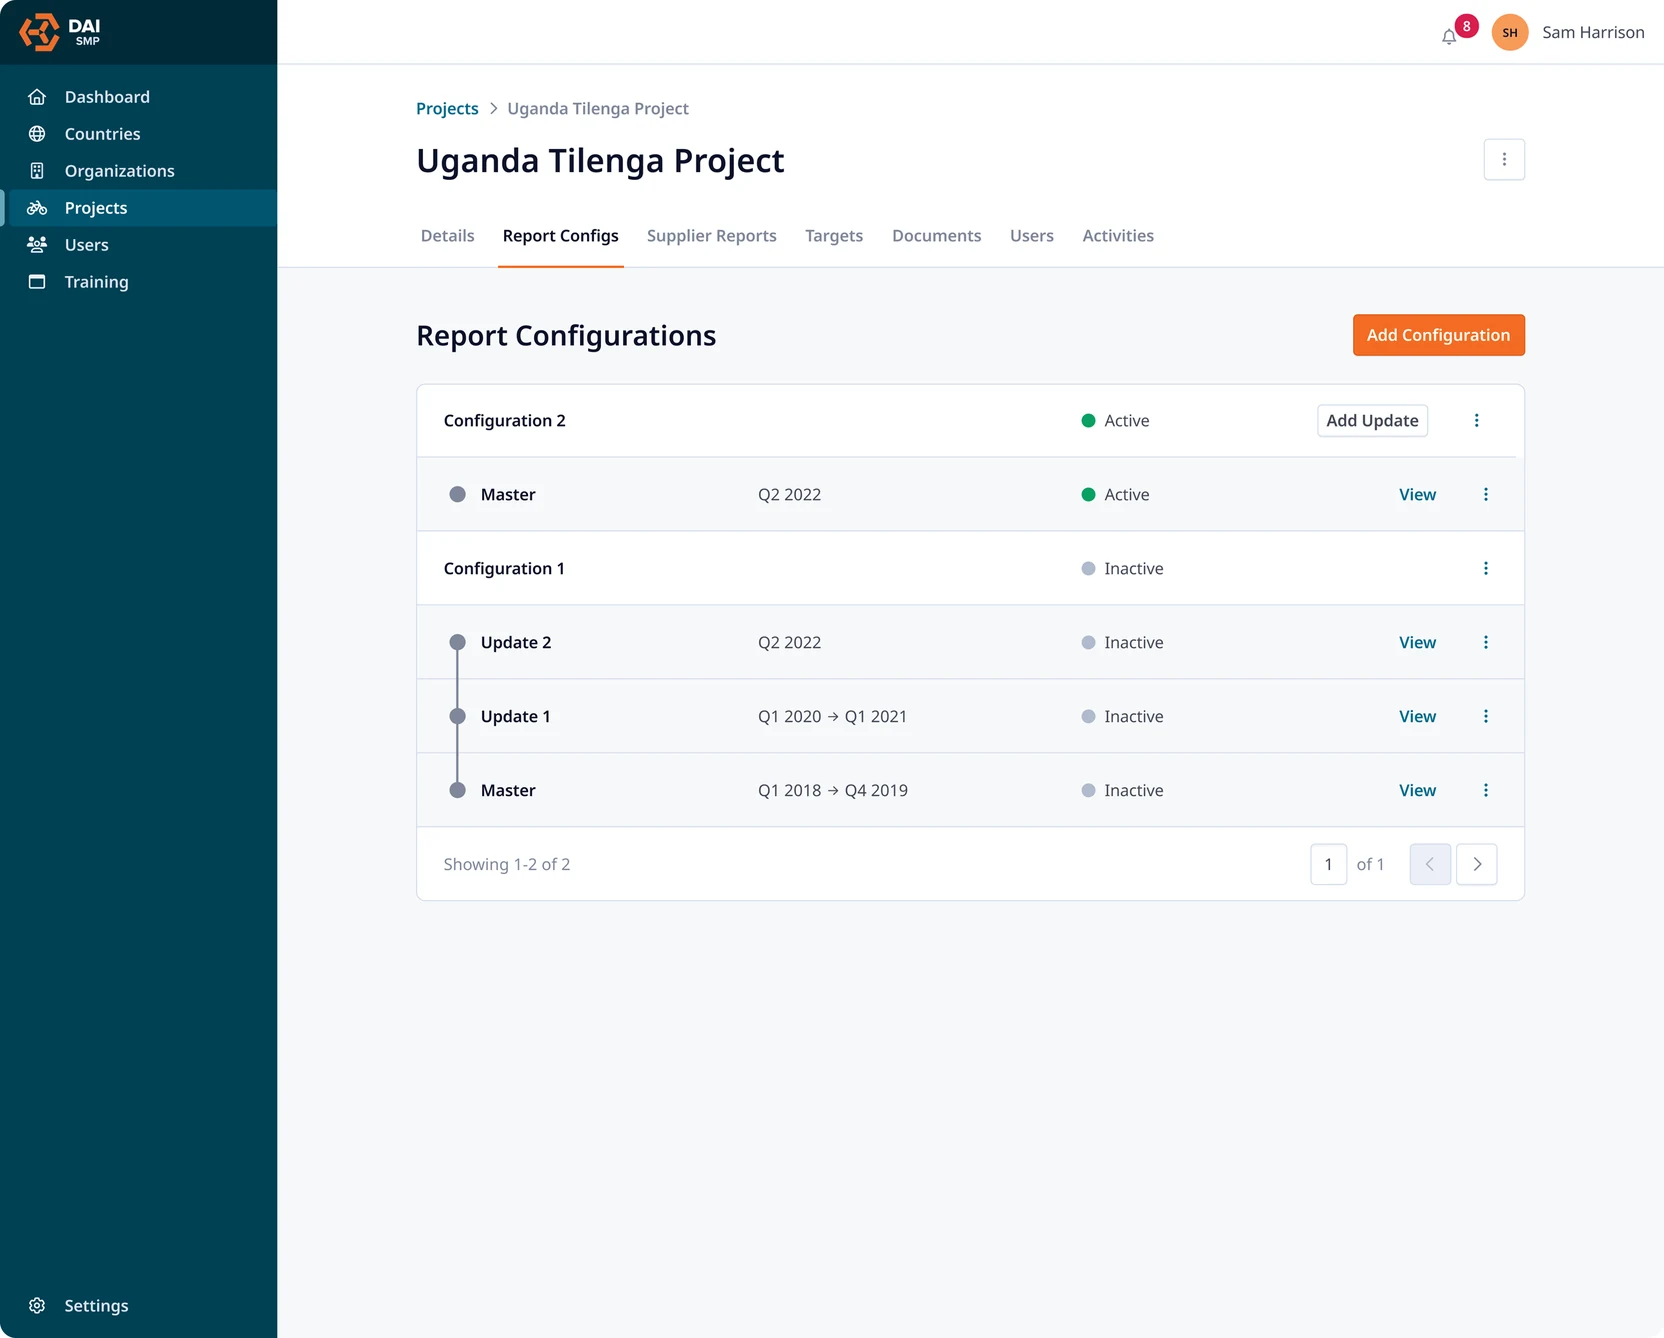
When reporting needs evolve, users can update configurations or spin up new ones, without disrupting data continuity. There are extensive aliasing capabilities to allow for multi-project data aggregation while preserving regional terminology and needs. Built from real use cases, Report Builder now powers 98% of new client reporting setups.
Impact
The redesigned reporting experience transformed how buyers and suppliers engage with local content data. What was once a fragmented, manual process is now streamlined, visual, and adaptive.
DAI teams gained full control: able to configure, launch, and adjust reporting requirements without engineering support. Buyers access clear insights on local spend and economic impact, improving transparency with local authorities. Suppliers, in turn, are guided through a simpler submission flow, increasing completion rates and data reliability.
What began as a compliance tool has become a platform for visibility, accountability, and smarter decisions at scale.